Geoscience Reference
In-Depth Information
a
50
b
q=
−34
45
40
30
−26
30
20
15
−18
0
t(q)
−30
−20 −10
0
30
40
10
20
−10
10
−15
−
0
2
10
1
26
34
−30
0
−45
−10
−60
−20
q
−2
−1.8 −1.6
Log
e
−1.4
−1.2 −1
−0.8
−2.2
c
1.6
1.4
1.2
d
1
0.8
1
0.6
0.8
0.4
0.6
0.4
0.2
0
0.2
0
−40 −30 −20 −10
0
10 20
30
40
50
0.25
0.5
0.75
1
1.25
1.5
q
a
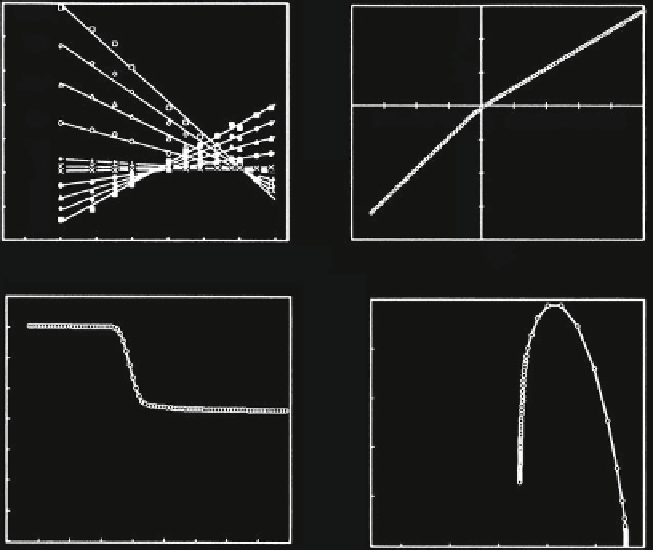
Fig. 11.7 Results of method of moments applied to Pulacayo zinc concentration values.
(a) Log-log plot for relationship between
ˇ
(
,
q
) and
; straight lines obtained by method of least
E
E
squares (LS). (b) Estimates of
˄
(
q
) include slopes of straight lines in a.(c) Singularity
α
estimated
from b by central difference method. (d) Multifractal spectrum
f
(
E
¼
1/100
corresponds to sampling interval (
¼
2 m); logarithmic scales have base 10 (Source: Cheng and
Agterberg
1996
, Fig. 2)
α
). Smallest cell size
˄
(
10)
¼
14.1234
0.4267. The absolute value of the difference between these
slopes is 4.2534
0.4797 which is significantly different from 0. This clearly shows
that the underlying model is multifractal instead of monofractal.
11.2.2 Histogram Method
Evertsz and Mandelbrot (
1992
) discuss that a histogram can be constructed for the
singularities
2
in 2-D applications. The
binomial frequencies of the concentration values
x
i
generated by the model of de
index
d
. Setting
n
α
i
associated with measures such as
ʼ
i
¼
x
i
·
E
¼
14 and
d
¼
0.4 as for Fig.
10.22
gave the results shown in
Search WWH ::

Custom Search