Geoscience Reference
In-Depth Information
3.0
2.5
2.0
1.5
1.0
0.5
0.0
0.0
0.2
0.4
0.6 0.8
10
Log(
e
)
1.0
1.2
1.4
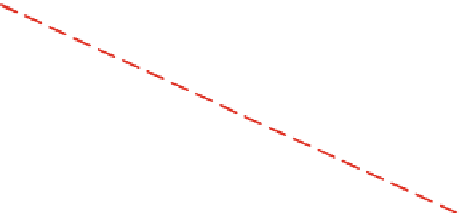
Fig. 10.13 Estimation of box-counting dimension
D
b
for point pattern of gold deposits shown in
Fig.
10.9
. Original data were taken from columns 2 and 4 in Table 1 of Agterberg et al. (
1993
). The
straight line with value of
D
b
¼1.528 was fitted to eight largest-box values only, assuming that
there is a roll-off effect in values for the smaller boxes. It is noted that Raines (
2008
) assumed the
pattern of Fig. 10.13 to be bifractal (Source: Agterberg
2013
, Fig. 4)
10.2.2 Cluster Density Determination of Gold Deposits
in the Larger Abitibi Area
89,600 km
2
) with
1,306 gold deposits (from a compilation by Agterberg et al.
1972
). It measures
560 km east-west and 160 km north-south. Subjecting he larger area to fractal
cluster modeling by the method described in the previous section gave
D
c
¼
The Kirkland Lake area (Fig.
10.9
) is part of a larger study area (
¼
1.514
(Agterberg
1993
). This is close to
D
1.493 and other estimates mentioned
previously. The larger study area covers most of the Abitibi Volcanic Belt on the
Canadian Shield. It shows many more large holes in the pattern of gold deposits
than can be seen in Fig.
10.9
. This lacunarity is mainly due to the occurrences
of terrains underlain by Archean granite intrusions and gneisses, which are devoid
of gold deposits. It was already discussed before that the sizes of the large gold
deposits in the Abitibi Volcanic Belt satisfy a fractal Pareto frequency distribution
(Fig.
10.8
)
In Agterberg (
1993
), the enlarged study area with 1,306 small and large gold
deposits was used to illustrate the calculation of the variance of mean values of
numbers of deposits in blocks for regional resource evaluation studies. The study
area was partitioned into 3,584 (5
¼
5 km) unit cells forming 32 rows and 112 col-
umns. The corresponding estimate of intensity is
0.3644. In an
earlier study, Agterberg (
1981
) had used the following computer algorithm to
estimate the reduced second moment measure
ʻ
(
¼
1,306/3,584)
¼
ʻ
2
(
r
)/
ʻ
with (5
5 km cells) was successively centered on each of the 1,306 gold deposits.


Search WWH ::

Custom Search