Geoscience Reference
In-Depth Information
12.0
10.0
7.0
L
2c
(r)/l
c
=4.452r
-0.486
5.0
4.0
3.0
E
2.5
ENE
2.0
ESE
1.5
N
0.2
0.4
0.6 0.8 1.0
Distance (r) in units of 5 km
2.0
4.0
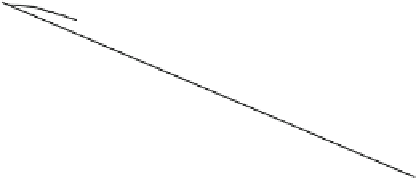
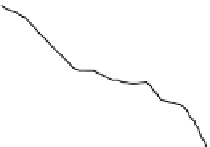
Fig. 10.14 Second-order intensity functions for 1,306 gold deposits in Abitibi volcanic belt.
Vertical scale is for
c
where subscript
c
denotes relation to cluster fractal dimension. Affine
transformation of original point pattern by factor 2.5 in the north-south direction resulted in
approximate isotropy as can be seen from observed second-order intensities for four different
directions estimated after the transformation. Both scales are logarithmic; the second-order
intensity is larger than the covariance density because it has not been centered (Source: Agterberg
1993
, Fig. 8)
ʻ
2
c
(
r
)/
ʻ
Frequencies of other deposits occurring within cells of this grid in the vicinity of
each deposit were determined and added in order to obtain total frequencies. In each
case, only the frequencies for cells falling within the study area were used. This
earlier method to correct for edge effects using squares is less precise than when
cluster density estimation results in an unbiased estimate of
ʻ
2
(
r
)/
ʻ
in the aniso-
tropic case can be found in Stoyan et al. (
1987
, p. 125; also see Falconer
2003
). The
resulting frequency distribution had elliptic contours elongated in the east-west
direction. Reduction of the east-west coordinates by the factor 2.5 resulted in
approximately circular contours on a compressed map. The (5
5 km) unit cells
on this transformed map correspond to rectangular cells on the original map
measuring 12.5 km in the east-west direction and 5 km in the north-south direction.
Estimated intensity for the compressed map is
0.9110. Estimated
second-order intensity values for the compressed map are shown in Fig.
10.14
.
For distances less than 20 km, it is seen that approximately,
ʻ
c
(
¼
2.5
ʻ
)
¼
r
0.486
in four
ʻ
2c
(
r
)
/
different directions. The corresponding cluster dimension is
D
c
¼
1.514. Because
cluster density estimation is not affected by affine transformation,
D
c
¼
1.514 for
the original map as well.
The function
ʻ
2
(
r
) is not centered with respect to a mean value. The so-called
covariance density
C
(
r
)
2
ʻ
2
(
r
). By means of
standard statistical methods,
C
(
r
) can be used to estimate the variance of the
number of points within a rectangle of any shape (Agterberg
1993
, p. 319). For
¼
ʻ
2
(
r
)
ʻ
is the centered form of


Search WWH ::

Custom Search