Geoscience Reference
In-Depth Information
0.4
0.4
0.2
0.2
0.0
0.0
−
0.2
−
0.2
−
100
−
80
−
60
−
40
−
20
LAG IN YEARS ( CLAY SERIES SLIDED WITH RESPECT TO SILT SERIES)
0
20
40
60
80
100
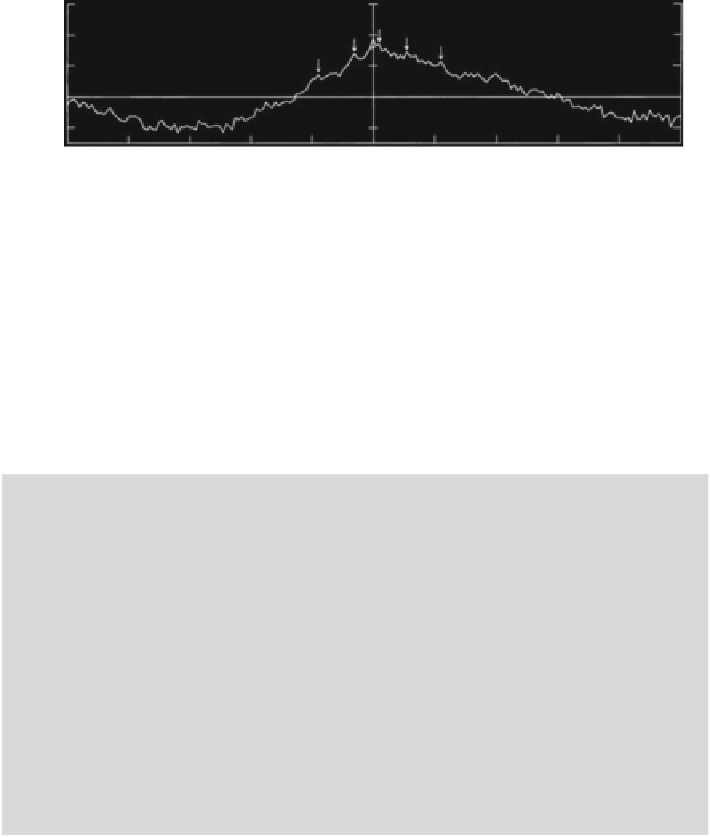
Fig. 6.9 Cross-correlation function for residuals from linear trend, clay, series 4. Weak oscilla-
tions with period of 10 years indicated by
arrows
. Note that the correlation coefficient for zero lag
is only slightly larger than its neighboring values, indicating that the noise components for silt and
clay are nearly uncorrelated (Source: Agterberg and Banerjee
1969
, Fig. 11)
sunspot cycle is visible in the cross-correlogram of Fig.
6.9
.Inthisdiagram,itcanbe
seen that the clay leads the silt by about 2 years. Such phase differences are better
studied by using cross-spectral analysis. The fitted curves in Figs.
6.7
and
6.8
satisfy an
equation for a stochastic model to be explained later (Sect.
6.1.3
).
Box 6.3: Cross-Spectrum, Coherence and Phase
The cross-spectrum consists of the co-spectrum
C
sc
(
f
) and the quadrature
spectrum
m
Q
sc
(
f
)
with:
C
sc
(
f
)
¼
r
sc
(0) +
k
¼1
[
W
(
k
)cos 2
ˀ
kf
{
r
sc
(
k
)+
∑
k
¼1
[
W
(
k
)sin 2
ˀ
r
cs
(
k
)}]. In these expres-
sions,
W
(
k
) is the same weighting function as before. The data were standard-
ized and
r
sc
(
k
)and
r
cs
(
k
) together form the cross-correlation function shown in
Fig.
r
cs
(
k
)}]; and
Q
sc
(
f
) ¼
∑
kf
{
r
sc
(
k
)
6.9
.
The
coherence
R
(
f
)
and
phase
ˆ
(
f
)
satisfy:
q
C
sc
ðÞþ
Q
sc
ðÞ
P
s
ðÞP
c
ðÞ
arctan
Q
sc
ðÞ
C
sc
ðÞ
Rf
.
R
(
f
) is a measure of the
strength of linear relationship between the two series for frequency bands
around
f
. It is equivalent to the correlation coefficient between two variables
as a function of frequency (Koopmans
1967
).
ðÞ
¼
and
ˆ
ðÞ
¼
f
As mentioned before, the power spectrum
P
(
f
) represents a decomposition of
total variance of a series in terms of variance components for narrow frequency
bands. Likewise, the coherence is the decomposition of the total correlation coeffi-
cient between two variables. For example, Anderson (
1967
) has shown that two time
series can be uncorrelated when time is not considered as a variable whereas, in
reality, the long-term fluctuations are negatively correlated and the short-term fluc-
tuations positively correlated (or vice versa). Partial correlation with trend elimina-
tion can give a solution to problems of this type but cross-spectral analysis may
provide a more refined answer. The coherence
R
(
f
) is positive for all frequencies and
should not be interpreted separately from the phase
ˆ
(
f
) that can be either positive or
180
and 180
. When the phase is close to 180
or
negative and falls between
180
, the two variables are nearly 180
out of phase implying negative correlation.
Search WWH ::

Custom Search