Geoscience Reference
In-Depth Information
0.6
14
0.4
28
0.2
42
0.0
−
0.2
10
20
30 40
LAG IN YEARS
50
60
70
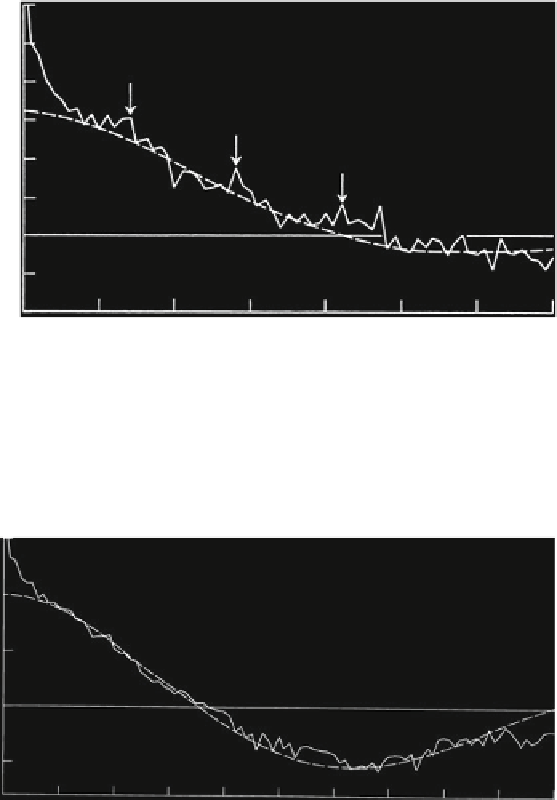
Fig. 6.7 Correlogram for residuals from linear trend, silt, series 4. The 14-year periodicity that
shows as a weak oscillation is indicated by
arrows
. Fitted curve satisfies stochastic differential
equation of second order Markov process with
c
¼0.32,
ʱ
¼0.03, and
ˉ
0
¼0.05 (Source:
Agterberg and Banerjee
1969
, Fig. 9)
1.5
1.0
0.5
0.0
-0.5
0
20
40
60
80
100
LAG IN YEARS
Fig. 6.8 Correlogram for residuals from linear trend, clay, series 4. Fitted curve satisfies
stochastic differential equation of second order Markov process with
c
¼1,
ʱ
¼ 0.01, and
ˉ
¼0.05 (Source: Agterberg and Banerjee
1969
, Fig. 10)
0
in the 201 cross-correlationcoefficientsshowninFig.
6.9
. The three figures based on
residuals instead of original thickness data confirm results obtained by spectral analysis
in the preceding section but produce additional information as well. The new silt
correlogram (Fig.
6.7
) clearly shows the 14-year periodicity that could not be perceived
in the correlogram of original silt data shown in Fig.
6.3
. The 10-year (and 20-year)
sunspot cycle that is evident in Fig.
6.5
(series 4) cannot be seen in the clay residual
correlogram of Fig.
6.6
. As pointed out before, all periodicities in the power spectrum
for series 4 are underestimated by about 10 % due to missing varves. The 11-year
Search WWH ::

Custom Search