Geoscience Reference
In-Depth Information
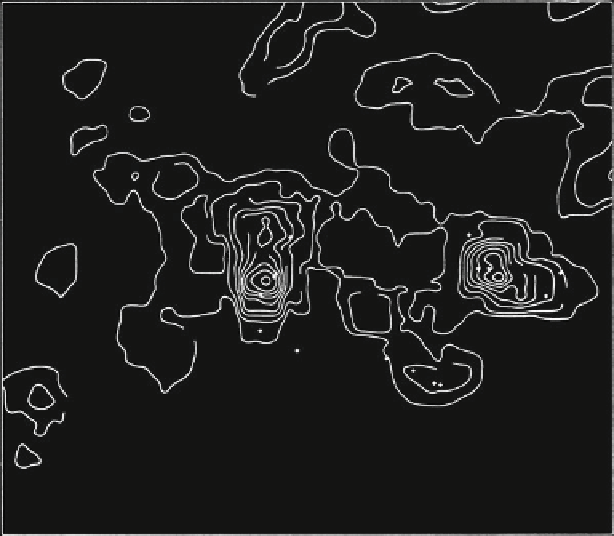
Fig. 5.22
Occurrences of nickel-copper deposits as predicted by linear model as in Fig.
5.21
(Source: Agterberg
1974
, Fig. 4)
5.2.3 Gowganda Area Gold Occurrences Example
The purpose of the following experiments on 90 gold deposits in the Gowganda
Area (1,405.51 km
2
) located between Timmins and Sudbury in the Abitibi
Subprovince on the Canadian Shield is to compare WofE with the more flexible
weighted logistic regression method. These experiments were originally conducted
by Agterberg and Bonham-Carter (
2005
). Other GIS applications from this region
in east-central Ontario that have been published include a WofE study by Thiart
et al. (
2006
). The Gowganda area was divided into small cells (pixels). The gold
occurrences are modeled as single pixels representing discoveries at points. In most
other WofE and WLR applications used for example in this chapter, the study area
was not subdivided into gridded pixels but unique conditions measured by GIS
were used. However, both methods (gridded pixels or unique conditions) work
equally well when resolution is adequate.
The Gowganda study area was subdivided into 560,976 small (100 m
100 m)
cells. In Experiments 1 and 2, about 25 % of the cells were randomly selected to
provide two training sets. In Experiments 3-5, geographically coherent 'blocks'
each measuring about 25 % of the study area, were used as training sets. In each
experiment, the remaining 75 % of the study area was used as testing area. Model
parameters (coefficients or weights) estimated on the training set were used to
estimate favorability of all cells. In some experiments, training and testing areas
Search WWH ::

Custom Search