Geoscience Reference
In-Depth Information
(a)
(b)
(c)
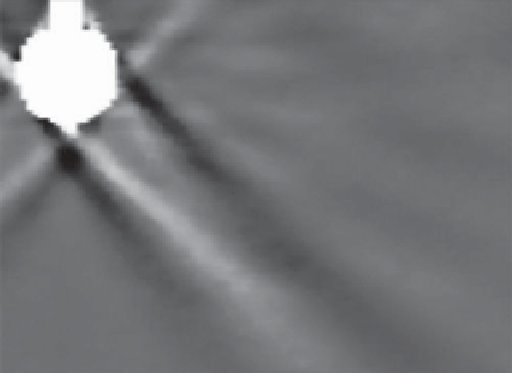
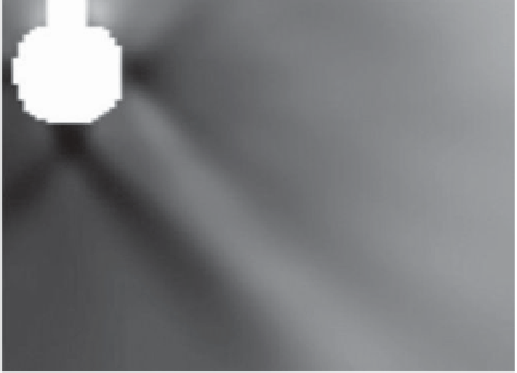
Figure 10.5.
Quantitative synthetic schlieren applied to the circumstance shown in Figure 10.4, in which (a) the horizontal
displacement of dots behind the tank is used to compute the (assumed spanwise-uniform) horizontal perturbation density gradient
of fluid in the tank, as indicated by intensity of the gray scale. (b) Vertical dot displacements are used to compute the vertical
density gradient. (c) The two components of the density gradient are integrated to find the perturbation density field. Reproduced
from Figure 13 of
Dalziel et al.
[2000].
where the background buoyancy frequency is less than the
wave frequency.
Following a theoretical approach analogous to that
used in thin-film optics for light or in quantum mechan-
ics for electrons,
Sutherland and Yewchuk
[2004] showed
that internal waves can partially transmit (i.e., “tunnel”)
through a weakly stratified layer provided it is thin com-
pared to the horizontal wavelength of the incident waves.
For piecewise constant profiles of the background buoy-
ancy frequency, they predicted the transmission coeffi-
cientT
T
as a function of the relative frequency of the waves,
ω/N
0
, and their relative horizontal wave number
k
x
L
in
which
N
0
is the far-field buoyancy frequency and
L
is the
depth of the thin stratified layer with buoyancy frequency
N
1
. The predictions are shown in Figure 10.8 for the cases
of an unstratified layer, a weakly stratified layer, and a
strongly stratified layer.
Counter to intuition based upon ray theory, one sees in
particular that waves can partially reflect from a strongly
stratified layer even though their frequency is always
smaller than the background buoyancy frequency.
Of course, the phenomenon is well known in optics.
Indeed,
Mathur and Peacock
[2010] made the analogy
between internal waves and light showing that they behave
like a Fabry-Perot multiple-beam interferometer. The
resulting resonance of internal waves in a localized region
of enhanced stratification was demonstrated in laboratory
experiments, shown in Figure 10.9.