Geoscience Reference
In-Depth Information
Figure 6.5 shows a dispersion diagram in the zone of
baroclinic instability. Two Rossby waves, one propagating
in each layer, are in resonance having the same Doppler-
shifted phase speed and giving rise to a baroclinic insta-
bility, as explained, e.g., in
Hoskins et al.
[1985]. The
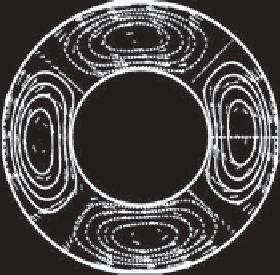
structure of the unstable mode is shown in Figure 6.8a.
Figure 6.6 shows a dispersion diagram in the Rossby-
Kelvin instability area. The gravest radial Rossby mode
propagating in the upper layer resonates with a Kelvin
wave propagating in the lower layer and gives rise to the
dominant RK instability; see
Sakai
[1989] and
Gula et al.
[2009a]. Resonances of higher Rossby modes with the
Kelvin wave give weaker RK instabilities, and the reso-
nance of a lower-layer Rossby mode with a Poincaré wave
gives the RP instability. The structure of the most unstable
RK and RP modes is shown in Figures 6.8b and 6.8c.
Figure 6.7 shows a dispersion diagram in a KH insta-
bility area. A Kelvin wave propagating in the upper layer
resonates with another Kelvin wave propagating in the
lower layer and gives rise to a KH instability. For these val-
ues of parameters we can see that RP and RK instabilities
are also present but with lower growth rates. The structure
of an unstable KK mode is shown in Figure 6.8d.
Thus RK and KH instabilities coexist for large Bu and
Ro having comparable growth rates although different
characteristic wave numbers. As follows from Figure 6.7
and from the comparison of Figures 6.2 and 6.3, in gen-
eral, close values of the growth rates may correspond
to essentially different wavelengths of the most unstable
modes. This means that different instabilities may coexist
and compete.
6.3. STABILITY OF OUTCROPPING
BUOYANCY-DRIVEN BOUNDARY CURRENTS
6.3.1. Equations of Motion, Basic States, Linearization
and Boundary Conditions
Another configuration used in experiments with the
rotating annulus is the free surface-outcropping one
[
[Griffiths and Linden
, 1982;
Pennel et al.
, 2012]. Note that
outcropping was excluded in the analysis of the previous
(
a
)
4
4
4
3
3
3
2
2
2
1
1
1
0
0
0
-1
-1
-1
-2
-2
-2
-3
-3
-3
-4
-4
-4
-4
-3
-2
-1
0
1
2
3
4
-4
-3
-2
-1
0
1
2
3
4
-4
-3
-2
-1
0
1
2
3
4
(b)
1
1
1
0.8
0.8
0.8
0.6
0.4
0.6
0.4
0.6
0.4
0.2
0.2
0.2
0
-0.2
0
-0.2
0
-0.2
-0.4
-0.4
-0.4
-0.6
-0.8
-0.6
-0.8
-0.6
-0.8
-1
-1
-1
-1 -0.8 -0.6 -0.4 -0.2
0
0.2
0.4
0.6
0.8
1
-1 -0.8 -0.6 -0.4 -0.2
0
0.2
0.4
0.6
0.8
1
-1 -0.8 -0.6 -0.4 -0.2
0
0.2
0.4
0.6
0.8
1
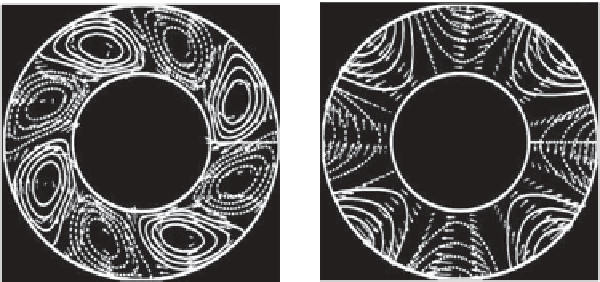
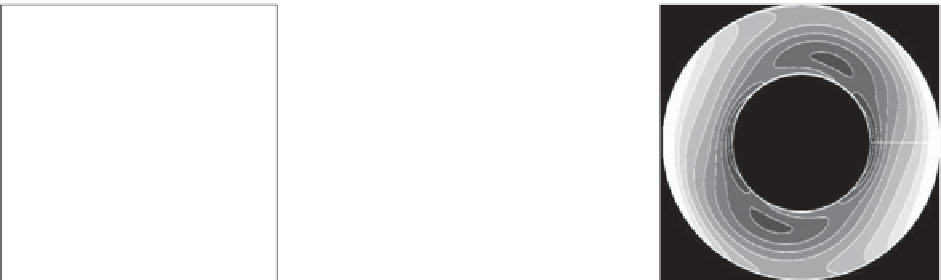
Figure 6.8.
Pressure and velocity fields in the upper (left) and lower (middle) layers and interface height (right) of (a) the baro-
clinically unstable RR mode at
k
=2
kR
d
= 0.9, see Figure 6.5), (b) the unstable RK mode at
k
=4
kR
d
=7.5,see
Figure 6.6),