Geoscience Reference
In-Depth Information
0.15
0.25
0.35
89
90
2
1
0
-1
-2
85
86
87
88
2
1
0
-1
-2
81
82
83
84
2
1
0
-1
-2
0.15
0.25
0.35
0.15
Fitted Values
0.25
0.35
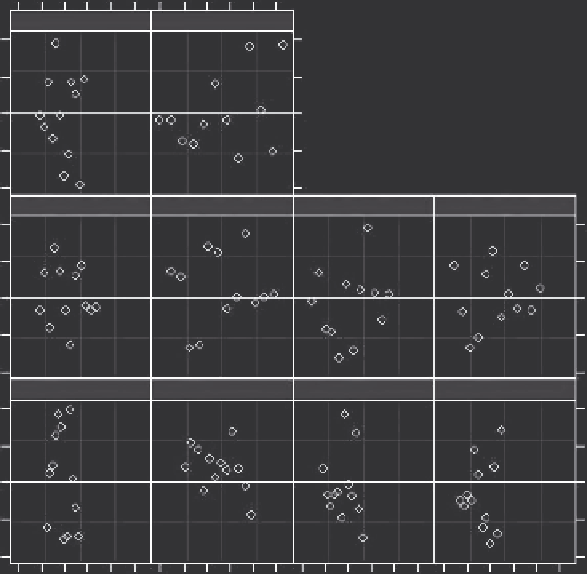
FIGURE 11.10
Standardized residuals from each station plotted against the fitted values.
Another check is to plot the standardized residuals (i.e., the residuals
divided by their standard error) versus the fitted values for each station, as
shown in Figure 11.10. This is to see if the residuals appear to have a random
scatter with no upward or downward trends and if the variation remains
equal across the range of fitted values. Departures from a random scatter
pattern, for example, with a funnel-shape pattern with more variation with
larger fitted values would suggest that the model should be reviewed. If a
funnel-shape pattern is observed, then transforming the raw data may be a
suitable solution, or a more sophisticated analysis using generalized linear
models may be needed. For the present study, there is no indication from
looking at the plots in Figure 11.10 that the pattern is not random.
Standardized residuals tend to be used for these types of analyses because
this makes it easier to detect any unusual observations. Most of the standard-
ized residuals should be in the range between −3 and 3, and anything outside
this should be examined carefully. An outlying data point might be a coding
error that can be easily fixed or might suggest some problem with the model.