Geoscience Reference
In-Depth Information
Intercept
0.21
0.18
0.15
-1.5
-1.0
-0.5
0.0
0.5
1.0
1.5
eoretical Quantiles
Slope
0.020
0.010
-1.5
-1.0
-0.5
0.0
0.5
1.0
1.5
eoretical Quantiles
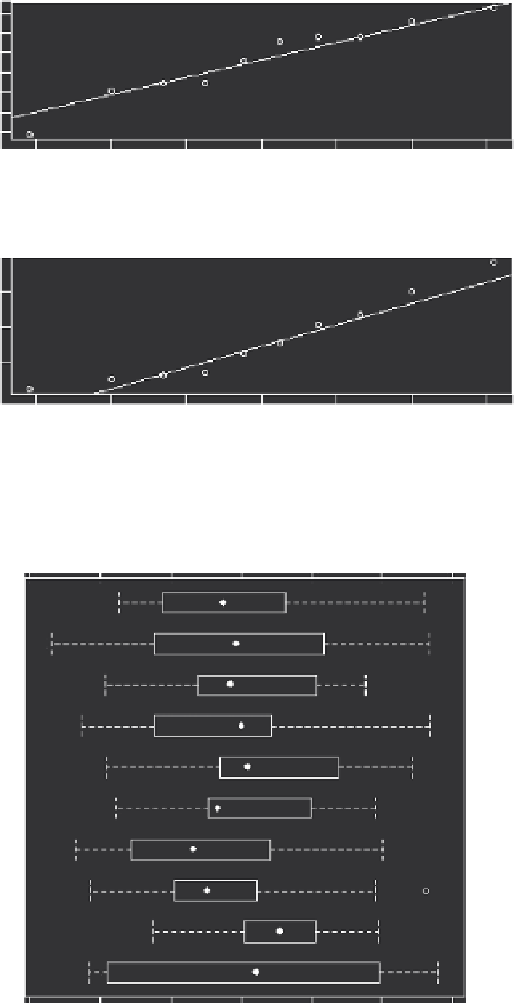
FIGURE 11.8
Normal Q-Q plot of the predicted intercept and slope coefficients.
90
89
88
87
86
85
84
83
82
81
-0.10
-0.05
0.00
0.05
0.10
0.15
Residuals
FIGURE 11.9
Model residuals from each station.