Geoscience Reference
In-Depth Information
kyr cal BP
10
9
8
7
6
5
4
3
2
1
0
2
a
m
msl
0
-2
-4
-6
-8
-10
Wismar Bay
-12
-14
10
9
8
7
6
5
4
3
2
1
0
2
b
m
msl
0
-2
-4
-6
-8
-10
Fischland
-12
-14
7
4
2
1
0
10
9
8
6
5
3
2
c
m
msl
0
-2
-4
-6
-8
-10
N-Rügen/
Hiddensee
-12
-14
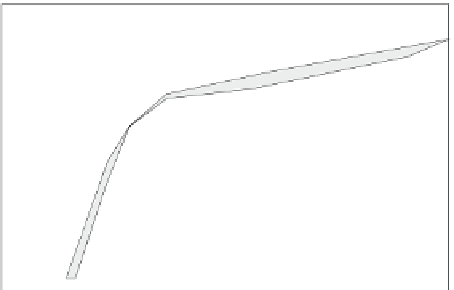
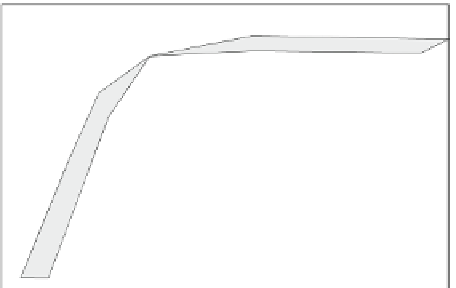
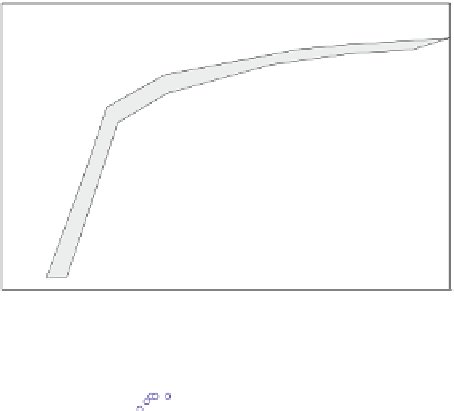
Fig. 12.3
Relative sea level (RSL) curves for the Wismar Bay (
a
), Fischland (
b
) and north
Rügen/Hiddensee (
c
).
Red triangles
designate data from terrestrial deposits,
green diamonds
desig-
nate telmatic deposits and
blue circles
designate archaeological finds in marine nearshore deposits.
Horizontal bars
represent double standard deviation (2
),
vertical bars
indicate estimated altitude
error of sea-level position. The sea-level curves are depicted as error envelopes within which the
sea-level position most probably was located
σ