Geoscience Reference
In-Depth Information
kyr cal BP
10
9
8
7
6
5
4
3
2
1
0
8
6
4
2
0
m
msl
-2
-4
N
-
Rügen/Hiddensee
Fischland
Wismar
Belgian coast msl upper limit
S-Sweden Baltic coast
German North Sea coast
Polish Baltic coast
-6
-8
-10
-12
-14
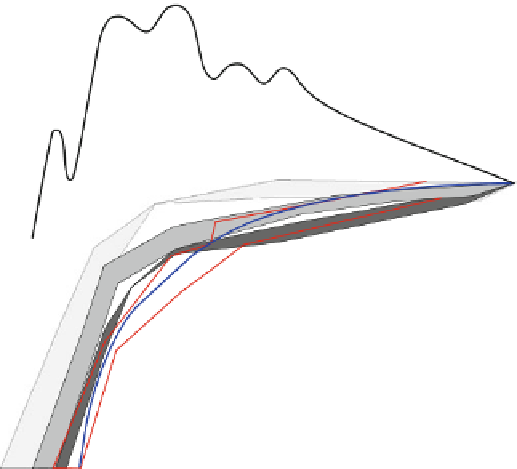
Fig. 12.4
Error bands of the RSL curves for Wismar Bay, Fischland and N-Rügen/Hiddensee. For
isostatic movement of the other coastal areas. Higher sea-level curves are influenced
by uplift, while the lower ones are influenced by subsidence. The north-eastern
German coast, therefore, belongs to the outermost edge of the Scandinavian uplift,
where the isostatic upheaval, or unloading effect, fades out. In the areas around
Wismar and Fischland, the isostatic emergence already ceased more or less but it
probably continues on Rügen. More recently, for the Wismar area, even a slight
subsidence seems possible. These conclusions are in line with the results of the
gauge investigations. Also the Polish coast seems to be stable. However, this curve
and the German North Sea curve were constructed from regionally wider distributed
data and, therefore, differences in movement between single coastal sections were
possibly not detected.
12.4.2 Relief Prior to Transgression
eastern German Baltic coast can be deduced. Obviously, more barriers occur
eastwards of the Fischland than westwards and are wider, longer and probably more