Geoscience Reference
In-Depth Information
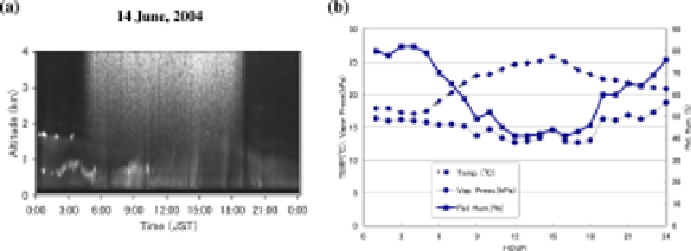
Fig. 3. Clear-sky case on 14 June, 2004. (a) Lidar data. From 6:00 to 15:00, the mixing
layer develops and then it decays. (b) Variations of temperature, relative humidity, and
water vapor pressure.
6.1.2
.Wintercase
In winter, both temperature and relative humidity are low. As an example
of clear sky, the case of 3 February, 2005 is shown in Fig. 4. Lidar data
in Fig. 4(a) show nearly constant aerosol concentration up to 4 km, and
the development of mixing layer is not seen. The variations of temperature
and relative humidity are shown in Fig. 4(b). The changes in temperature
and relative humidity are from 0
◦
C-10
◦
C and from 55% to 20%, while the
change in water vapor pressure is relatively small (from 3.5 to 2.3 hPa).
The wind velocity becomes maximum in the daytime, and the direction is
NNW with 10 m/s speed.
3 Feb., 2005
3 Feb., 2005
12
60
4
10
50
3
8
40
Temp.(
C)
Wat.Vap.Press.(hPa)
Rel.Hum.(
°
2
6
30
°
C)
4
20
1
2
10
0
0:00
3:00
6:00
9:00
12:00 15:00 18:00 21:00
0:00
0
0
1 2 3 4 5 6 7 8 9 101112131415161718192021222324
HOUR
Time (JST)
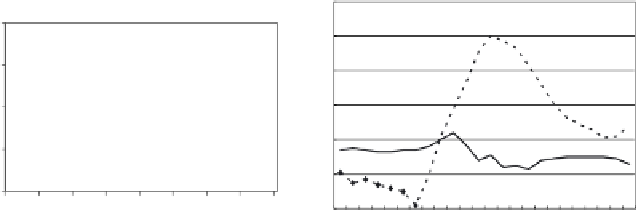
Fig. 4. Clear-sky case on 3 February, 2005. (a) Lidar data. No development of the
mixing layer is observed. (b) The diurnal variation of temperature, relative humidity,
and water vapor pressure.