Geoscience Reference
In-Depth Information
Table 20.3
Upper mantle velocities for the average Earth model.
Thickness (km)
V
PV
(km/s)
V
PH
(km/s)
V
SV
(km/s)
V
SH
(km/s)
Q
μ
η
Water
3.00
1.45
1.45
0.00
0.00
1.00
∞
Crust1
12.00
5.80
5.80
3.20
3.20
1.00
600
Crust2
3.40
6.80
6.80
3.90
3.90
1.00
600
LID
28.42
8.02
8.19
4.40
4.61
.90
600
LVZ top
7.90
8.00
4.36
4.58
.80
80
LVZ bottom
7.95
8.05
4.43
4.44
.98
80
220 km
8.56
8.56
4.64
4.64
1.00
1.43
400 km
8.91
8.91
4.77
4.77
1.00
143
Regan and Anderson (1984).
ations (Hager and O'Connell, 1979). This is con-
sistent with the fast (a-axis) of olivine being
aligned in the flow direction. The main differ-
ences between the kinematic return-flow models
and the Rayleigh-wave azimuthal variation maps
occur in the vicinity of hotspots. A large part of
the return flow associated with plate tectonics
appears to occur in the upper mantle, and this
in turn requires a low-viscosity channel. Figure
20.12 is a map of the azimuthal results for 200-s
Rayleigh waves. The lines are oriented in the
maximum velocity direction, and the length of
the lines is proportional to the anisotropy. The
azimuthal variation is low under North Amer-
ica and the central Atlantic, between Borneo
and Japan, and in East Antarctica. Maximum
velocities are oriented northeast-southwest under
Australia, the eastern Indian Ocean and north-
ern South America and east-west under the cen-
tral Indian Ocean; they vary under the Pacific
Ocean from north-south in the southern central
region to more northwest-southeast in the north-
west part. The fast direction is generally perpen-
dicular to plate boundaries.
Hager and O'Connell (1979) calculated flow in
the upper mantle by taking into account the drag
of the plates and the return flow from subduction
zones to spreading centers. Flow lines for a model
that includes a low-viscosity channel in the upper
mantle are shown in Figure 20.12. Flow under
the large fast-moving plates is roughly antipar-
allel to the plate motions. Thermal buoyancy is
ignored in these calculations, and there is no lat-
eral variation in viscosity. An interesting feature
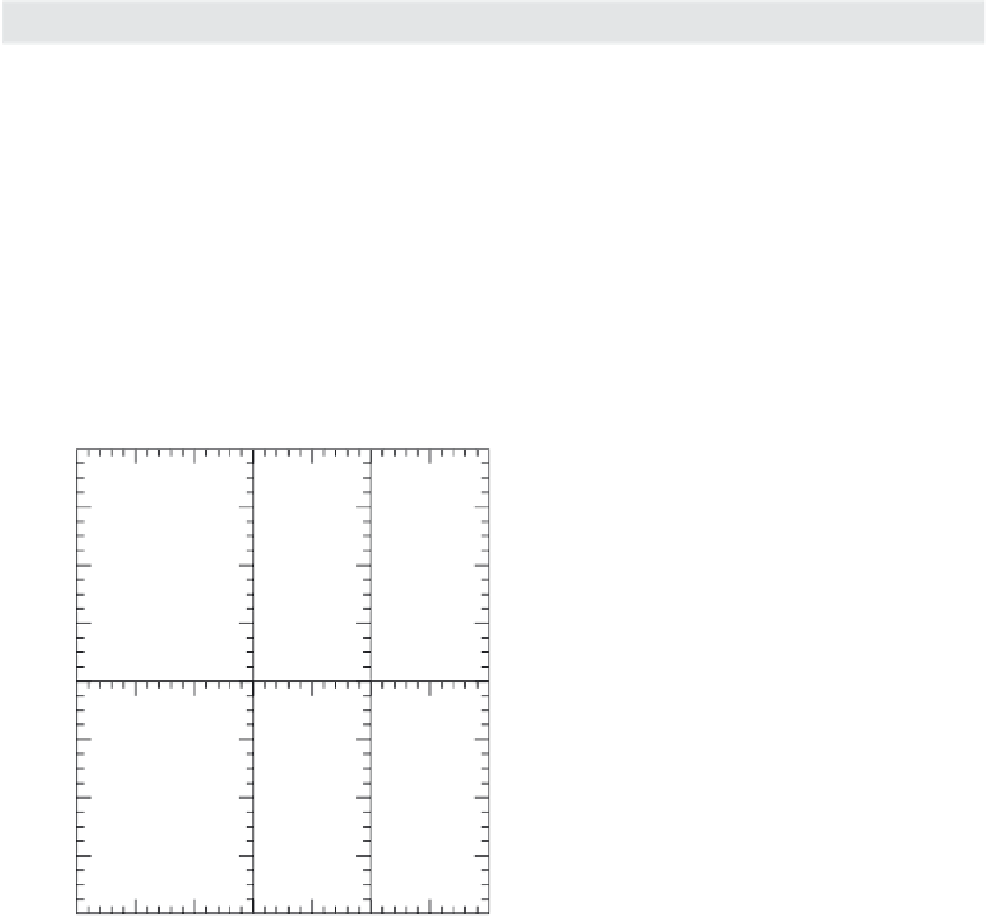
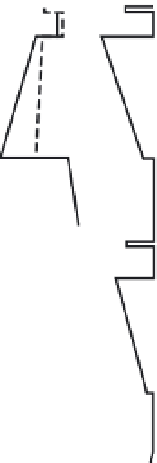
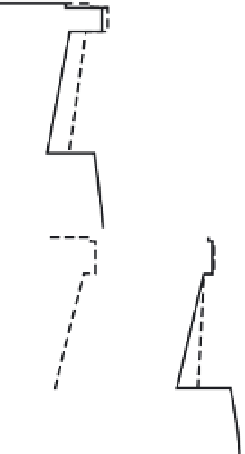
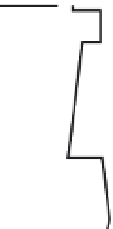
0
80
160
240
320
80
160
240
320
3.5
4.0
4.5
5.0
8.0
9.0
1.0
1.2
η
Velocity (km/s)
Fig. 20.11
Velocity depth profiles for the 50--100 Ma
(upper set) and the
>
100 Ma (lower set) old oceanic regions.
a-axes of olivine-rich aggregates tend to cluster
around the flow direction, the a and c axes
concentrate in the flow plane, and the b axes
align perpendicular to the flow plane [
Nicolas
& Poirier anisotropy
]. For P-waves the a, b,
and c axes are, respectively, the fast, slow, and
intermediate velocity directions. If the flow plane
is horizontal, the azimuthal P-wave velocity
There is good correlation of fast Rayleigh
wave directions with the upper-
mantle return
flow
models derived from kinematic consider-