Geoscience Reference
In-Depth Information
T
M
R
0
VSH
80
160
M
T
240
R
320
80
160
R
M
T
M
T
R
240
320
3.5
4.0
4.5
5.0
Velocity (km/s)
8.0
9.0
1.0
η
1.2
Temperature
VSV
Fig. 20.10
Velocity depth profiles for the 0--20 Ma (upper
set) and the 20--50 Ma (lower set) old oceanic-age provinces.
From left: PV, SV, and ETA; dashes are PH and SH.
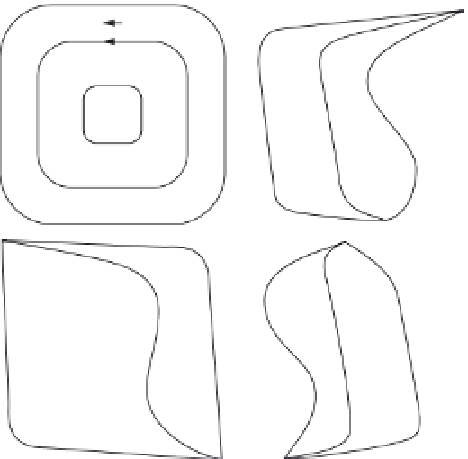
Fig. 20.9
Schematic representation of seismic velocities
due to temperature, pressure, and crystal orientation
assuming a flow-aligned olivine model. The upper left diagram
shows a convection cell with arrows indicating flow direction.
The trench is indicated by T, the ridge by R, and the midpoint
by M. The lower left diagram shows temperature depth
profiles for the trench, ridge and midpoint. The upper and
lower right diagrams show the nature of the velocity depth
structure of
V
SH and
V
SV, respectively due to pressure,
temperature and crystal orientation.
models, the velocity of Love waves along ridges
is expected to be extremely slow. The velocity of
Rayleigh waves is predicted to be high along sub-
duction zones. For midplate locations, Love-wave
velocities are higher and Rayleigh-wave velocities
are lower than at plate boundaries.
The average Earth model (Table 20.9) takes
into account much shorter period data than used
in the construction of PREM. Note that a high-
velocity LID is required by this shorter wave-
length information. This is the seismic litho-
sphere. It is highly variable in thickness, and an
average Earth value has little meaning. The seis-
mic LID is about the same thickness as the strong
lithosphere, and much thinner than the thermal
boundary layer and, probably, the plate.
At the ridge and at the trench the flow is verti-
cal, rapidly changing to horizontal at the top and
bottom of the cell. For vertical flow the horizon-
tal velocity is controlled by the
b
-axis and
c
-axis
velocities, so SH
PV. The values at
the top and bottom of the cell rapidly change to
the horizontal flow values. Between the midpoint
and the trench or ridge, the transition from hori-
zontal to vertical flow velocities becomes sharper,
and the depth extent of constant vertical veloci-
ties increases.
For
<
SV and PH
<
Azimuthal anisotropy
the
100--200
km
depth
range
for
the
youngest
SV. The vertical flow
expected in the ridge-crest environment would
exhibit this behavior. The temperature gradients
implied are 5--8
◦
C per kilometer for older ocean.
The young ocean results are consistent with reori-
entation of olivine along with a small tempera-
ture gradient. With these temperature and flow
regions,
SH
>
Maps of global azimuthal and polar-
ization anisotropy
are now readily avail-
able. Anisotropy of the upper mantle may orig-
inate from preferred orientation of olivine -- and
other -- crystals or from a larger-scale fabric per-
haps related to ancient slabs in the mantle. The