Geoscience Reference
In-Depth Information
(a)
42ºN
41ºN
1.9
2.2
40ºN
69ºW
68ºW
67ºW
66ºW
Longitude
(b)
(c)
0
0
20
10
30
5
Georges
Bank
Georges
Bank
100
100
200
200
0
10
20
Distance (km)
30
0
10
20
30
Distance (km)
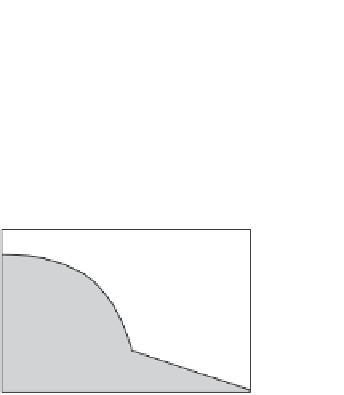
Figure 8.7
(a) Contours of SH over Georges Bank, indicating vigorous mixing over the bank
contrasting with strong stratification off-bank. The dashed line is the 100-metre isobath.
Arrows show the pronounced circulation around the bank which results from a combination
of baroclinic forcing and tidal rectification. (b) and (c) show the along bank velocity
(cm s
1
) on a cross-bank section over the north of the Bank in winter (b) and summer (c).
Adapted from (Loder and Wright,
1985
; Butman et al.,
1987
), with permission from MIT
Press and the Journal of Marine Research.
by a number of drifters deployed in the area and tracked by the Argos satellite
system. The resulting estimates of the Lagrangian currents, illustrated in
Fig. 8.6a
,
are in general agreement with the flow observed by ADCP and provide further
confirmation of the flow pattern deduced from the density field
Where an isolated mixed region occurs in a surrounding stratified sea, a continu-
ous tidal mixing front will border the mixed zone. Such a situation is formed on the
north-western Atlantic shelf by the strong tidal mixing over Georges Bank. This
results in complete vertical homogeneity on the bank throughout the year as we
would expect from the distribution of SH shown in
Fig. 8.7a
. During the summer, as
stratification develops in the deeper water, a tidal mixing front is established around
the bank with a baroclinic jet as seen in
Fig. 8.7b
and c, with speeds up to
50 cm s
1
around the bank (Loder and Wright,
1985
; Butman et al.,
1987
). In this case,
∼


Search WWH ::

Custom Search