Geoscience Reference
In-Depth Information
(a)
-10
(-10)
(-14)
(-10)
(17)
(3)
(-6)
(-11)
(25)
(20)
-50
-100
0
10
20
30
40
50
60
(b)
-10
-50
-100
0
10
20
30
40
50
60
(c)
-10
-5
5
-50
-100
0
10
20
30
40
50
60
Distance (km)
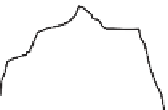
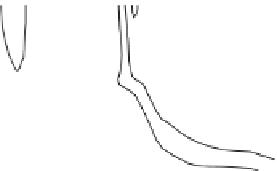
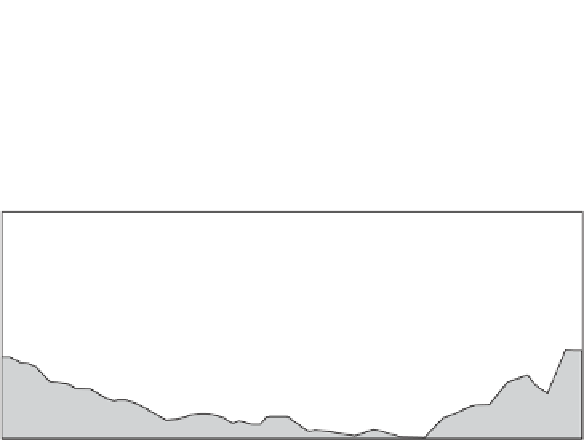
Figure 8.6
Section from west to east through a meander in the Celtic Sea tidal mixing front
(front D in
Fig. 8.1
). (a) Density contours s
t
(kg m
3
) from an undulating CTD, along with
measurements of velocity from drifter observations. Dotted circles are drifter velocities to the
south (out of the page), crossed circles are velocities to the north (into the page). The position
of the circles represents the depths of the drogues attached to the drifting buoys; numbers in
brackets by the drifter positions are drift speeds in cm s
1
. (b) Residual velocity (cm s
1
)
normal to the section inferred from the density using the thermal wind
Equation (8.7)
and
assuming velocity is zero at the seabed. (c) As (b) but residual velocities derived from the
shipborne ADCP with tidal flow removed. Adapted from Brown et al.,
2003
, with permission
from Elsevier.


Search WWH ::

Custom Search