Geoscience Reference
In-Depth Information
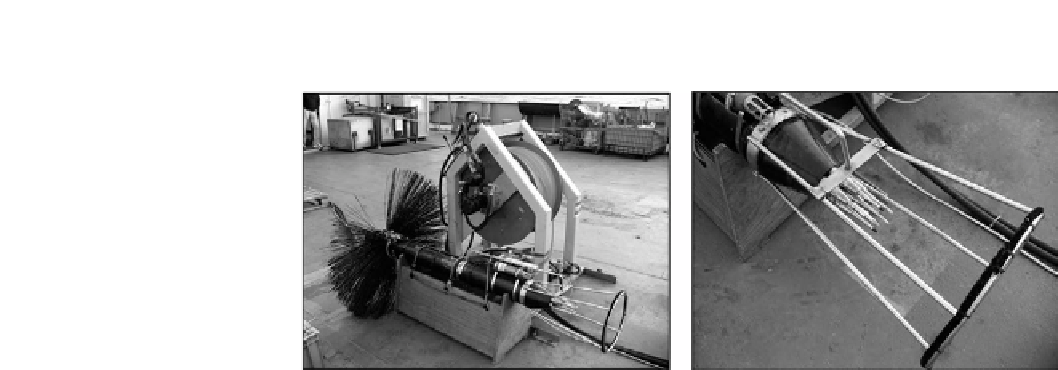
Figure 7.4
A free-fall turbulence microstructure profiler. Left: the profiler and its winch. The
brush at the top of the profiler provides drag, maintaining the profiler vertical in the water
column as it falls at 0.6-0.7 m s
1
. The turbulence sensors are inside the guard ring. The
light Kevlar cable provides power and retrieves data as the profiler falls towards the seabed.
Right: close up of the sensors and the guard ring which protects them when the probe hits
the seabed. As well as the shear sensors, two fast response thermistors are used to record
temperature fine structure. (Photos by J. Sharples.)
section of the water column, usually
1 metre, the minimum needed to give an
adequate sample of the turbulence, which is generally highly variable. Further
improvement in the statistical reliability of estimates is achieved by averaging a
rapid sequence of repeat profiles. At the end of each profile, signaled by impact with
the bed, the profiler is hauled back to the surface by a light Kevlar tether which
contains pairs of electrical conductors carrying the high data rate signals to a
computer onboard the research vessel. As well as high resolution velocity, the
profiler is also equipped with sensors for temperature and conductivity so that
parallel profiles of temperature, salinity, density and hence the buoyancy frequency
are available. The rate of dissipation e (W m
3
) together with N
2
may be used to
estimate the mixing rate in the form of the eddy diffusivity via the Osborn relation
(Equation 4.63):
∼
N
2
e
K
z
¼
ð
7
:
11
Þ
m
2
s
3
).
We will also quote dissipation values in units of Wm
3
, which are widely used in the
literature. Numerical values in the latter units are larger by a factor of
2. Note that e here is in units of W kg
1
where
¼
R
f
=ð
1
þ
R
f
Þ
0
:
(
1000, i.e. the
density of seawater in kg m
3
. Dissipation can be measured by the profiler over most
of the water column, except for a region very close to the surface (within about
8 metres) which is excluded because of possible interference from the ship's wake and
the time it takes for the profiler to reach its terminal fall speed. Measurements
continue to within
∼
0.15 metres of the seabed when the guard ring hits the bottom.
The results of a time series of observations of e at the SWIS location are shown in
Fig. 7.5a
in the form of a contoured plot of log
10
e
∼
Wm
3
versus time and depth. This
log presentation is preferable because of the wide range of dissipation rates involved.
Have a look at
Box 7.2
to gain some understanding of the rates of turbulent energy
ð
Þ


Search WWH ::

Custom Search