Geoscience Reference
In-Depth Information
(a)
(b)
0.5
100
50
0
-0.5
195.5
196
196.5
197
195.5
196
196.5
197
0.5
100
50
0
-0.5
195.5
196
196.5
197
195.5
196
196.5
197
Yearday 2006
Yearday 2006
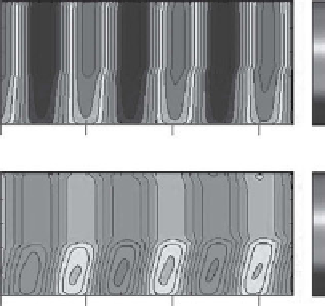
Figure 7.3
See
colour plates version.
Velocities along major (top) and minor (bottom) axes of
the tidal current ellipse at station SWIS (53
52.00' N, 05
27.00' W) in the stratified western
Irish Sea during July 2006: (a) measured using ADCP (from Simpson et al.,
2009
, with
permission of Elsevier), and (b) derived from the turbulence closure model driven by tidal and
wind stress forcing. Grey scales are the same for all panels. Black lines in (a) are isotherms at
10, 12, and 14
C, indicating the stratification of the water column.
model is to simulate the evolution of the density structure, the fluxes of nutrients
through the water column which control primary production and the interaction
between turbulent mixing and phytoplankton swimming.
7.2.1
Observing and modelling turbulent dissipation
We can assess the performance of the model in relation to mixing by comparing the
model with observations of turbulence in the water column in seasonally stratified
and continuously mixed regimes. The rate of production of turbulence is still difficult
to measure in all but the most tidally energetic regimes. However, the rate of
turbulent energy dissipation can be determined with free-fall shear profilers, such
as that shown in
Fig. 7.4
. As the profiler falls at a steady speed of w
p
∼
0.7 m s
1
,it
senses the relative horizontal velocity u
0
on scales down to
1 cm via an airfoil shear
probe (Osborn and Siddon,
1975
; Osborn and Crawford,
1980
) mounted in the nose.
The gradient of the horizontal velocity is obtained by differentiating the velocity with
respect to time to give a shear component
<
w
p
. The dissipation rate
e is then found from the relation for isotropic turbulence (Batchelor,
1960
):
@
u
0
=@
z
¼ð@
u
0
=@
t
Þ=
2
:
@
u
0
@
e
¼
7
:
5
ð
7
:
10
Þ
z
This relation assumes that the turbulence is isotropic at the high wave numbers (small
scales) which dominate the shear spectrum. The overbar denotes an average over a


Search WWH ::

Custom Search