Geoscience Reference
In-Depth Information
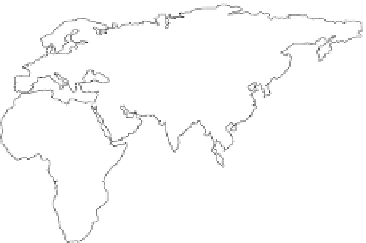
Fig. 3.2
Map of global dust sources, based on multiple years of satellite imagery, derived from
frequency of occurrence (number of days) where the TOMS absorbing aerosol index (
AAI
)is
greater than 0.7 (significant amounts of dust or smoke) or 1.0 (abundant dust or smoke). For
comparison, nonabsorbing aerosols such as sulfate and sea salt yield negative AAI values; clouds
yield values near zero; ultraviolet-absorbing aerosols such as dust and smoke yield positive values
(Prospero et al.
2002
).
Dark brown
is 21-31 days;
yellow
is 7-21 days (Redrawn from Fig. 4 of
Prospero et al.
2002
).
Blue arrows
indicate typical dust transport pathways, based on interpretation
of MODIS imagery from Terra and Aqua satellites by the authors
3.3.3
MODIS and MISR Imagery from the Terra and Aqua
Satellites
Gillette (
1999
) pointed out that many of the world's most important dust sources are
not always large regions with uniform emissions of dust across them. He coined the
phrase “hot spot” to identify relatively small areas that have a particularly favorable
set of characteristics for dust emission. This concept was developed further by Okin
et al. (
2006
) and with the subbasin geomorphology approach of Bullard et al. (
2011
).
The past couple of decades have added greatly to our identification of contemporary
“hot spot” dust sources. Here we present examples of identification of dust sources
using satellite imagery (Fig.
3.3
), set within the context of the “hot spot” concept
of Gillette (
1999
) and the preferential-dust-emission geomorphic scheme of Bullard
et al. (
2011
).
Dry lakebeds with abundant fine-grained sediments that are unconsolidated
constitute one of the most important dust emission sources throughout the world
(Gill
1996
)(e.g.,Figs.
3.1
b, c and
3.3
a, c). These lakebed sources are especially
prominent in North Africa, where today there is evidence that during the Holocene,


Search WWH ::

Custom Search