Geoscience Reference
In-Depth Information
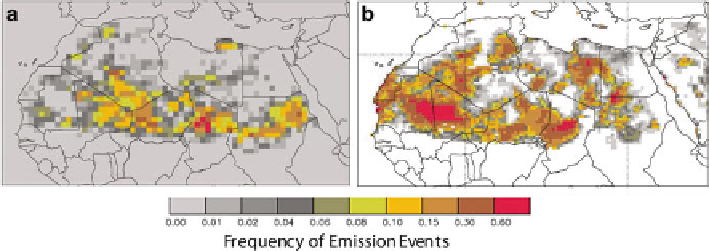
Fig. 9.2
Comparison of annual Saharan dust emission frequencies from geostationary Meteosat
satellite data (
a
; Schepanski et al.
2007
) and a global offline model (Tegen et al.
2004
)(
b
)
et al.
2010
). Alternatively to determining dust source areas from such remote
sensing products by assigning high frequencies of large dust loadings to potential
source regions, they can also be derived by tracking observed individual dust plumes
back to their source location. The spatial distribution of such dust source areas
derived by the different methods can differ considerably (Schepanski et al.
2012
).
This may be partly due to problems of quantifying the dust signal above bright land
As an example the Saharan dust source activation frequency computed with the
model of Tegen et al. (
2004
) that uses topographic depressions as preferential dust
sources is compared to the activation frequencies derived by the backtracking from
Meteosat satellite data (Schepanski et al.
2007
)(Fig.
9.2
). The evident differences
in the simulated source regions compared to the satellite-derived product may be
due either to a misrepresentation of dust source areas or meteorology in the model
or also to a smaller extent due to limitations of the satellite product (Brindley et al.
2012
).
Dust emission can only occur when the soil surface is bare or only sparsely
vegetated. Not only the vegetation cover but also the type of vegetation determines
its capacity to protect soil surfaces, particularly in semi-arid areas at desert fringes.
Non-forest biomes can be potential dust sources, that is, dust emissions can occur
when other criteria (including sparse vegetation cover, soil dryness and absence of
snow cover) are satisfied. To obtain an estimate of the monthly vegetation cover per
model grid cell, seasonal changes in vegetation cover can be derived from satellite
observations, for example, utilizing the fraction of absorbed photosynthetically
active radiation derived from monthly retrievals of the Normalized Difference
Vegetation Index results. Alternatively, results of vegetation models can be used
to provide information on vegetation cover and type as input information for
dust emission computations (e.g. Mahowald et al.
1999
). Using output from
vegetation models to mask dust sources for computing dust emissions is useful for
computations of past dust concentrations or projections of future changes.
Search WWH ::

Custom Search