Geoscience Reference
In-Depth Information
Mid-Century (2040-2059 average)
Mid-Century (2040-2059 average)
Ovals Added for
Location Comparison
~2050
~2090
12°F
10°
8°
6°
4°
2°
0°
12°F
10°
8°
6°
4°
2°
0°
High Emissions Scenario Low Emissions Scenario
Figure 3
USGCRP: Potential temperature increases
Ovals Added for Location Comparison-
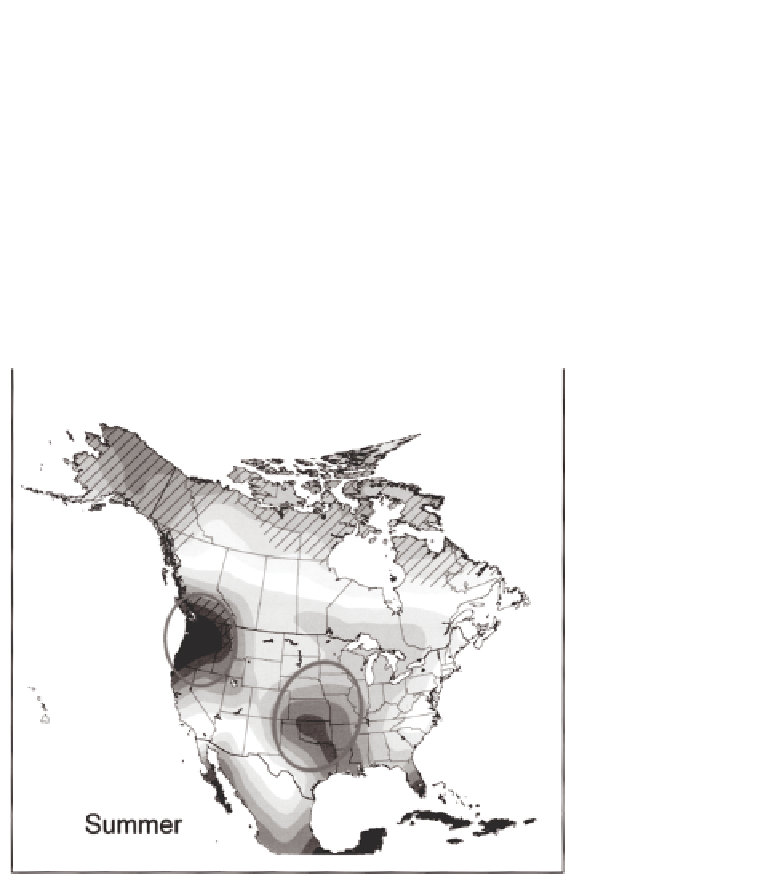
Major Areas of Reduced Precipitation
Figure 4
USGCRP: Potential
precipitation changes by
2080-2099
Summer
sible issues associated with temperature changes in a high emissions scenario. Figure
7
indicates more signiicant vulnerability issues for ethanol production, where about 80%
of current production comes from seven states that are subject to both precipitation and
temperature changes. Issues may also exist for oil and gas production in the U.S from
shale: e.g., water needs for shale gas fracturing.