Geoscience Reference
In-Depth Information
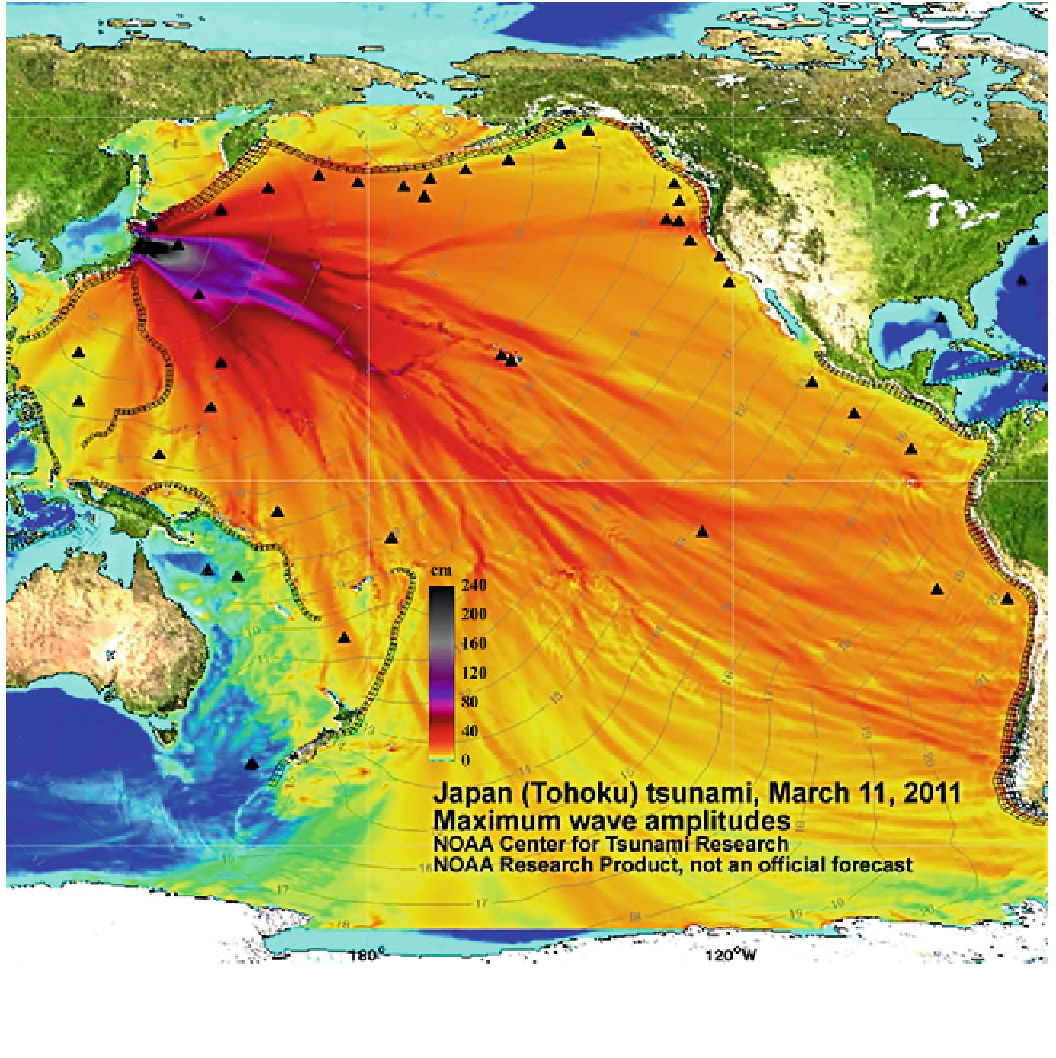
Fig. 2.7
Maximum wave heights for the T ¯hoku Tsunami of March
11, 2011, simulated across the Pacific ocean using the MOST (Method
of Splitting Tsunami) model. Source NOAA Center for Tsunami
generated close to shore because the critical distance over
which a tsunami wave develops is not long enough relative
to the tsunami's wavelength to generate a wave with a
leading crest. This critical distance may be as great as
100 km from shore—a value that encompasses many near-
coastal tsunamigenic earthquakes. N-waves, as shown in
Fig.
2.4
can take on two forms: simple and double (Geist
1997
). The double wave is preceded by a smaller wave. The
tsunami generated by the Indian Ocean Tsunami along the
south Sri Lankan coast was a double N-wave. Tadepalli and
where
H
rmax
=
maximum run-up height of a tsunami above sea
level (m)
H
t
= wave height at shore or the toe of a beach (m)
b
= slope of the seabed (degrees)
The run-ups derived from Eq.
2.11
are higher than those
predicted using sinusoidal waves. If a leading trough pre-
cedes the tsunami, then its form is best characterized by an
N-wave (Fig.
2.4
). These
waves are more
likely to be