Database Reference
In-Depth Information
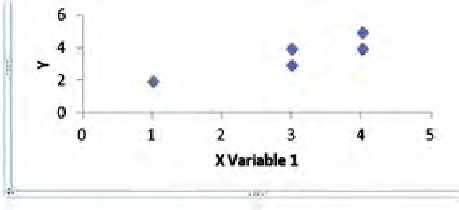
FIGURE 9.13
Scatter diagram.
FIGURE 9.14
Adding to the scatter diagram a line that, intuitively, its well.
FIGURE 9.15
Illustration of the least-squares deinition of “best.”
determine the “best-itting” line to the data (which, surely, will be close to the
line drawn “by eye” by the authors in
Figure 9.14
, but likely will not be identical
to it).
But hold on!
We cannot ind the “best-itting line” without deciding how to
deine “best-itting.” Well, in about 99.99% of the cases you would encounter, “best-
itting” is deined as the
least-squares line.
This is the line that minimizes the sum
(for all the data values) of the squared differences between the actual Y value and
the predicted Y value from using the line. Put another way, it is the line that best its
the actual scores and minimizes the error in prediction, using this criterion. This is
illustrated in
Figure 9.15
.


Search WWH ::

Custom Search