Database Reference
In-Depth Information
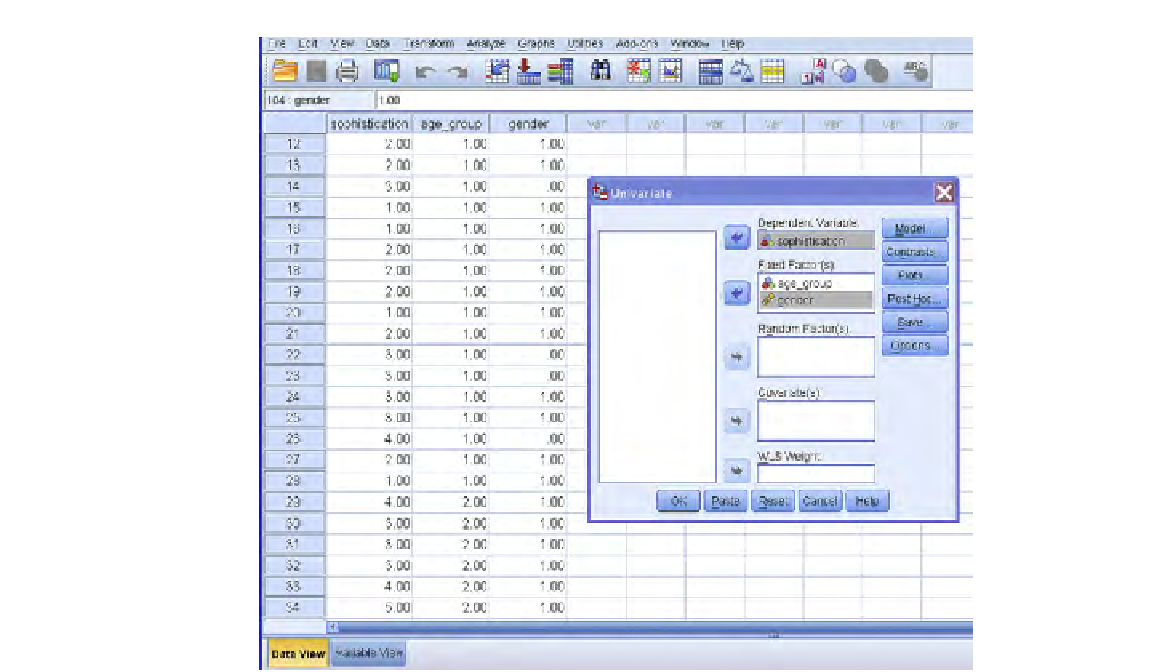
FIGURE 8.5
Preparing to run the two-factor ANOVA in SPSS.
We are playing a bit of a statistical joke here. Did you guess in advance that it was
coming? There are only two genders, and their means were judged to be signiicantly
different by the F-test. There is no further notion of how they are different! There are
only two sample means, and the difference between them is judged to indicate that
the true means are not the same.
That's the end of the story about gender alone, except of course, for the actual
difference itself. For the males (
n
= 41), the average sophistication is 2.95, while for
the females (
n
= 85), it is 3.60. It appears that women gave higher ratings of satisfac-
tion than males, aggregated over all the age groups. But an S-N-K test on gender has
nothing to add to the story. Indeed, you need at least three levels of the factor for any
multiple comparison test to add to the knowledge provided by the F-test; if there are
only two means, and we conclude from the ANOVA (F-test) that they differ, what
else can be said (beside the direction of the difference)? Nothing!
Now, let's consider the interaction effect. This is also signiicant (see solid arrow
in
Figure 8.7
), with
p
-value = 0.000. It is not useful from a practical viewpoint to try
to express the meaning of the interaction in terms of deinition 1: that the total differ-
ence is not equal to the sum of the two separate differences.
Search WWH ::

Custom Search