Database Reference
In-Depth Information
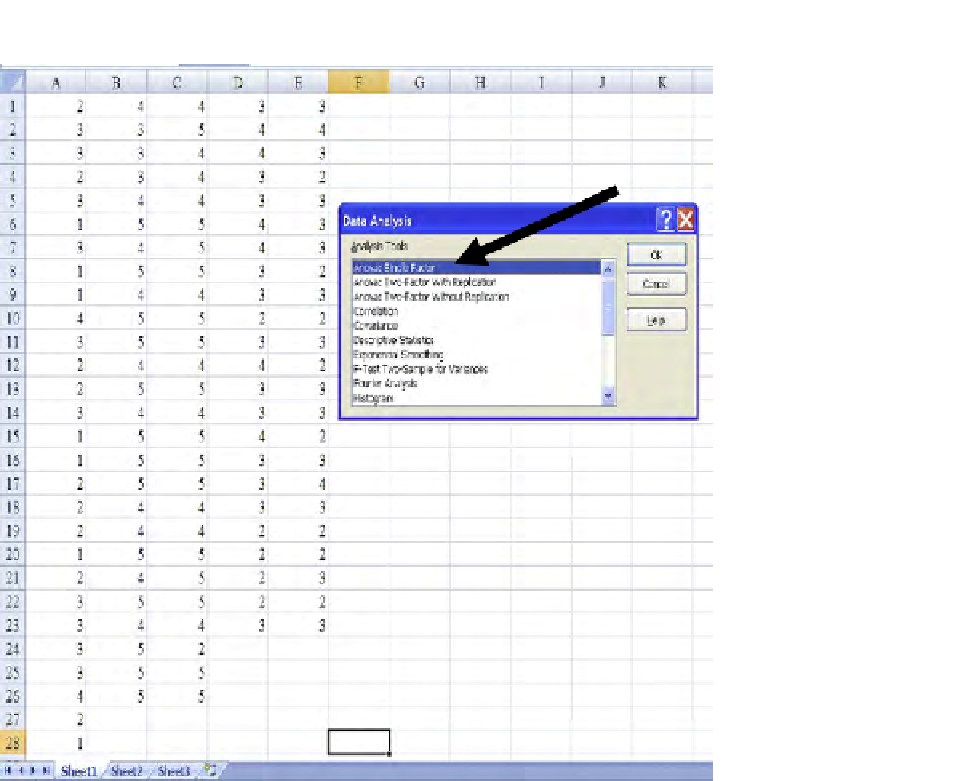
FIGURE 6.1
Opening “Data Analysis” and highlighting desired technique; Excel.
Next, we click on “OK” in the upper right corner (see “thick hollow arrow” in
Figure 6.2
). This will provide the output shown in
Figure 6.3
.
We now examine this output in
Figure 6.3
. The key value on the output, as always,
is the “
p
-value.” See arrow in
Figure 6.3
.
In this output, the
p
-value = 4.26E-24. As we have noted before, “E” means “expo-
nential” and really means “power of 10.” In other words, the
p
-value = 4.26 × 10
−24
,
or (with 23 zeros) 0.00000000000000000000000424. Obviously, this is (way) below
0.05; in fact, it's about as close to zero as you'll ever see! So, we reject H0 and go
with H1, and thus conclude that there is suficient evidence to be convinced that the
true averages of sophistication evaluation for the ive age-groups are not equal.
Now, we know what you may be saying to yourself: “So what? I want to know
where the signiicant differences are!”

Search WWH ::

Custom Search