Database Reference
In-Depth Information
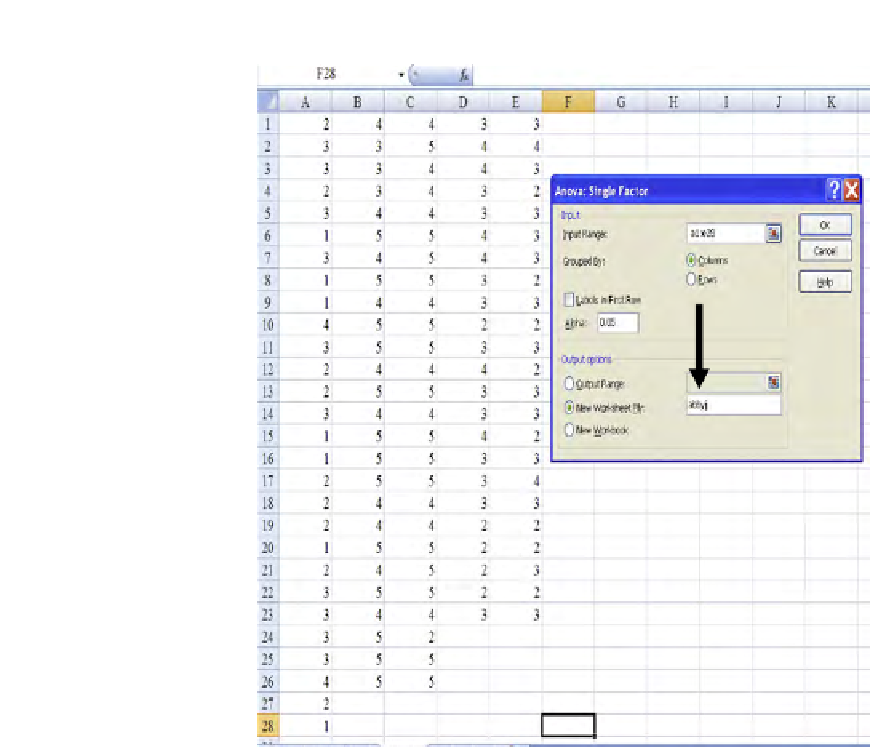
FIGURE 6.2
Opening up and illing in analysis of variance (ANOVA): one factor; Excel.
Well, there's a solution we will describe in
Section 6.5
and
Section 6.6
. In the
meantime, we can speculate; based on the means (top part of the output in
Figure 6.3
—
see oval), it would seem that age-groups 2 and 3 have higher true means than the other
age-groups, and it is not clear how the other 3 age-groups stack up against one another.
6.4.2
SPSS
Now we illustrate the same ANOVA analysis in SPSS. (If we're importing data from
another source (say, Excel), we must cut and paste the data into SPSS. And, as you
may recall from Chapter 2, the format of the data in SPSS is different from that of
Excel.) The example data input to SPSS is illustrated in
Figure 6.4
.
Figure 6.4
purposely is showing you the middle of the data, rows 20-42. The data
actually consist of 126 rows (since the samples sizes per column are 28, 26, 26, 23,


Search WWH ::

Custom Search