Geology Reference
In-Depth Information
Temperature (°C)
6˚
0
25
50
75
100
125
5˚
0
4˚
3˚
500
2˚
1000
1˚
0˚
1500
−1˚
−2˚
2000
−3˚
DKS1
−4˚
2500
−5˚
−6˚
3000
−7˚
13˚ 14˚ 15˚ 16˚ 17˚ 18˚ 19˚ 20˚ 21˚ 22˚ 23˚ 24˚ 25˚ 26˚ 27˚ 28˚
3500
−60
−40
−20
0
20
40
60
4000
Fig. 12.1
Residual gravity map obtained by removing the attraction of
sediment (Kadima Kabongo et al.
2011b
). The map shows a NW-SE
gravity high interpreted as the remnant effect of crustal thinning during
the Proterozoic rifting and eventually reactivated during the break-up
of Gondwana. The location of the four deep boreholes is shown by
black dots
, the seismic by
grey lines
, the heat-flow at Mbuji-Mahi
(44 mW m
2
)bya
yellow triangle
and the xenoliths by
green
diamonds. The inset shows the location of the Intracratonic Congo
Basin (CB)
4500
MDB1
GLS1
5000
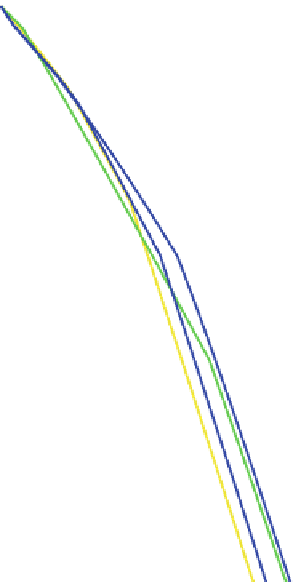
Fig. 12.2
Bottom Hole Temperatures in Gilson 1 and M
bandaka 1
wells and the present-day geotherm calculated for different erosion
hypothesis (see Fig.
12.10
)
'
variations of the surface heat-flow (~16 mW m
2
at the
Grenville-Appalachian transition) are caused by the crustal
radiogenic heat-production (Mareschal and Jaupart
2004
). A
similar pattern is observed in south and east Africa (Nyblade
et al.
1990
), with variations at the surface that are also
related to the crustal heat-production (Jaupart and Mareschal
1999
). The vertical distribution of heat-producing elements
in the crust is well-constrained along the overturned
Vredefort crustal section exposed in the Kaapvaal craton,
which provides an estimate for the mantle heat-flow of
17 mW m
2
(Jones
1988
), and more likely 20 mW m
2
if
one accounts for paleoclimatic effects (Jaupart and
Mareschal
1999
). The higher mantle heat-flow can be
explained by a thinner lithosphere in South Africa
(~180 km according to Fishwick
2010
) than in Canada
(250-275 km in eastern Canada reported by Jaupart and
Mareschal
1999
).
In the Congo craton and Congo basin, there is conversely
no published data except at one site in the Mbuji-Mayi
region (Fig.
12.1
) where the heat-flow is 44
measurements in the Katangan belt published by Sebagenzi
et al. (
1993
) rather than data from Mbuji-Mayi (Sachse et al.
2012
). Artemieva (
2006
) considered that both heat-flow and
thickness of the lithosphere are not known in the CB, and
therefore speculated that they are similar to other reworked
Archean cratons during late Proterozoic or Paleozoic (e.g.
the Sino-Korean craton). In that case, the surface heat-flow
would be
50-55 mW m
2
and the lithosphere thickness
150 km, but several other empirical studies (Shapiro and
Ritzwoller
2004
; Goutorbe et al.
2011
) suggest significantly
lower values (35-50 mW m
2
).
However, there exist several bottom hole temperatures
(BHT) measurements in the Gilson 1 and M
'
bandaka 1 oil
wells (Fig.
12.1
) that can be processed together with geo-
physical logs to derive estimates of surface heat-flow.
Although large uncertainties due to mud circulations in the
wells are associated with these temperature measurements,
they are deep enough to provide reliable estimates. On the
Congo continental margin for instance (Lucazeau et al.
2004
), the differences between conventional surface
measurements and oil estimates are generally less than
10 %. The processing requires however careful estimates
of the thermal conductivity to account for the lithology and
20 mW m
2
(Sebagenzi et al.
1993
). However, several previous studies
that addressed the thermal regime of the CB have either used
empirical estimates based on measurements in similar geo-
logical contexts (e.g. Artemieva
2006
) or the average of


Search WWH ::

Custom Search