Geology Reference
In-Depth Information
porosity variations. Here, we combined lithology and geo-
physical logs, and core samples porosity measurements: the
inferred bulk thermal conductivity ranges between 1.8 and
2.2 W m
1
K
1
. We estimated the temperature gradient to
20 m km
1
(Kadima Kabongo et al.
2011b
), which leads to a
surface heat-flow in the CB of 35-45 mW m
2
in agreement
with the previous measurements (40-48 mWm
2
) at Mbuji-
Mayi (Sebagenzi et al.
1993
). This value ranges between the
average for the Kaapvaal craton granites domes in South
Africa (33
Temperature (°C)
0
200
400
600
800
1000
1200
1400
0
50
2mWm
2
) and the Witwatersrand basin
6mWm
2
) within this craton, but here we have no
information on the crustal heat-production. In the exposed
Vredefort section in South Africa, the radiogenic component
is high, between 1.0 and 1.8
(51
100
Wm
3
, and we assumed
therefore that the enriched crust in the CB (fixed arbitrarily
to 10 km) varies within this range: three models are consid-
ered with respective heat production of 1.25, 1.50 to
1.75
μ
150
LAB Kaapvaal
Wm
3
μ
. The remaining lower crust has a standard
200
Wm
3
value (Mareschal and Jaupart
2004
). Then, we
can determine the geotherms assuming a similar thermal
conductivity in the crust and in the mantle (including com-
position and temperature dependence) as assumed by
Mareschal and Jaupart (
2004
). For a surface heat-flow of
40 mW m
2
, the geotherm intercepts the 1,250
C isentro-
pic profile between 200 and 300 km depending on the crustal
heat-production (Fig.
12.3
).
The base of the thermal lithosphere can be compared to
the base of the seismic lithosphere, which varies between
200 and 250 km below the Congo basin according to recent
tomography (Fishwick
2010
). Most of other tomographic
studies provide similar conclusions (see review in Buiter
et al.
2012
). The heat-flow estimate of 40 mW m
2
is
therefore consistent with the seismic observations, providing
that the total radiogenic contribution to surface heat-flow is
24-27 mWm
2
and the mantle heat-flow 13-16 mWm
2
.
There is also evidence from kimberlites xenoliths and
xenocrysts at the south and southeast of the CB that the
base of the lithosphere is ~ 210 km (Batumike et al.
2009
),
corresponding to a 35 mWm
2
surface heat-flow according
to the authors. Our calculations (Fig.
12.3
) show that the
xenoliths data can be also explained by a surface heat-flow
of 40 mW m
2
and a total radiogenic contribution of
27 mW m
2
(Fig.
12.3
). The xenoliths temperature/depth
conditions from the Kaapvaal craton (James et al.
2004
)
show a significantly warmer geotherm (Fig.
12.3
) in agree-
ment with the shallower lithosphere-asthenosphere bound-
ary. This good agreement between the surface heat-flow, the
seismic tomography and the equilibration of xenoliths in
these two different regions suggests that the present-day
thermal regime of the CB is reasonably well constrained.
Kimberlites from the Mbuji Mayi region intrude Cretaceous
terranes up to 120 Ma and two megacrystic zircons are dated
at
0.4
μ
LAB Congo Basin
250
35 mWm
−2
40 mWm
−2
45 mWm
−2
Mbuji Mayi
Luebo
Kundelungu
Kaapvaal
300
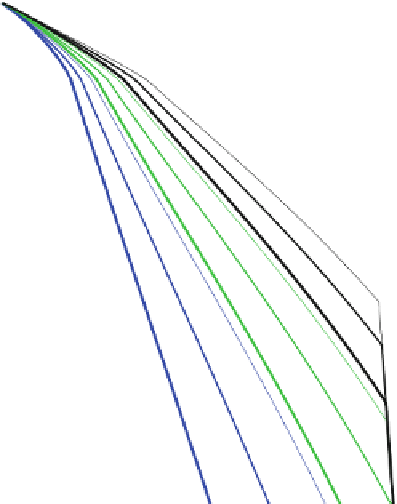
Fig. 12.3
Temperature-depth profiles for different surface heat-flows
and radiogenic heat-productions: the
thick lines
correspond to higher
heat-production (1.75
Wm
3
)
μ
than the
thin lines
(1.50 and
Wm
3
) in a 10 km enriched upper crust. The heat-production
in the lower crust (10-40 km) corresponds to a standard value
(0.4
1.25
μ
Wm
3
). The geotherms are calculated for stationary conditions.
The
coloured dots
correspond to the xenocryst geotherms given by
garnet- olivine equilibration temperature (T
Ni
) and the Cr-saturated
garnet pressure (P
Cr
) for three locations in the Intracratonic Congo
Basin area (Batumike et al.
2009
). The
black dots
are xenoliths T/
depth from Kaapvaal craton (James et al.
2004
). The
purple squares
correspond to temperatures at 50 and 100 km provided by Artemieva
(
2006
). The
grey area
corresponds to the LAB depths given by seismic
studies (Fishwick
2010
)
μ
regime of the CB remained stable at
least since mid-
Cretaceous.
12.3
Subsidence of the Congo Basin
The sediments accumulated in sedimentary basins infill a
preexisting depression known as the
”
related to the actual mechanism of basin initiation. The
tectonic subsidence can be reconstructed back in time
substituting the sediment load by an equivalent water (or
air) load. The equation giving the subsidence
Y
from the
sediment
“
tectonic subsidence
70 Ma (Batumike et al.
2009
). Therefore, the thermal
thickness
S
,
the paleobathymetry
W
d
and the


Search WWH ::

Custom Search