Image Processing Reference
In-Depth Information
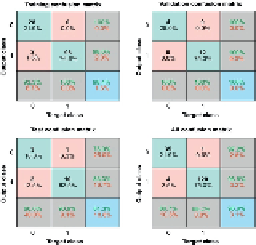
FIGURE 10
The confusion training, validation, and testing matrices.
Yet importantly, the NN agreed with the detection of cells using the proposed algorithm by
about 96.9%.
Next, I apply the C&R tree to the mentioned input and target variables. The tree is carried
out with a maximum depth of 5, a maximum of five surrogates, and the use of the Gini index to
measure impurity. As in the previous example, the tree has trained 144 or 80% of all samples,
and used 36 samples in validation and testing (i.e.. 20%). As a result, the tree achieved 95.83%
agreed with the target in the training process, whereas, in the testing samples (cells), achieved
92.86% correct. Moreover, the most important and effective determined input variable is the
eccentricity around 0.6786. The area variable comes in after eccentricity about 0.2576, followed
by the perimeter variable around 0.0358 and the convex area variable at the end about 0.0279.
Therefore, when using the C&R tree, the diagnosis may depend on the eccentricity, and, if ne-
cessary, the area variables, to distinguish the benign cells from the distorted ones.
Furthermore, the accuracy, sensitivity, and specificity in training samples have achieved
89.8%, 100%, and 82.1%, respectively. On the other hand, in the test samples, the accuracy,
sensitivity, and specificity achieved approximately 81.25%, 100%, and 66.7%, respectively. Al-
though the C&R tree is easier to apply to exported data than the NN is, it has achieved only
about 92.9% success, while NN has achieved 96.9%. Clearly, the previous application of NN
and C&R tree for the output data tends to show that NN is preferred and more effective than
the C&R tree for making predictions from these data. In other words, the NN appears to be
more effective at testing and checking the efficiency of the data resulting from the proposed
algorithm in order to detect the sickle cells among all those distorted and, thus, to diagnose
sickle-cell anemia. Finally, Matlab 2013a has been used to build the algorithm on Windows 7
with the processor Intel ® Core™2Duo CPU T5550@ 1.83 GHz, 2.50 GB RAM, and a 32-bit op-
erating system. The optical Nikon microscope digitized all blood cell images.
8 Conclusions
The microscopic-image analysis of human blood cells is a valuable tool for detecting distorted
blood cells. Sickle-cell anemia is one of the most important types of anemia. This chapter
presents a proposed algorithm for detecting and counting the sickle cells among all healthy
and distorted cells in a microscopic colored image, even if those cells are hidden or over-
lapped. I have used an algorithm with a CHT to detect benign and distorted blood cells. I
then classified the exported variable data (e.g., area, convex area, eccentricity, and perimeter)
for all detected cells (benign and distorted) as input variables, constructing a solidity measure
for all cells as a target variable. In the next step, I applied the NN and regression tree to pro-
duce the right decision for diagnoses and to check the effectiveness of the proposed detec-
Search WWH ::

Custom Search