Image Processing Reference
In-Depth Information
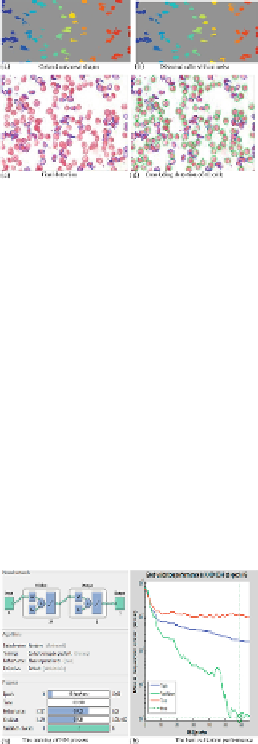
FIGURE 8
(a) All unknown shapes, (b) the distorted cells, (c) the final detection of only dis-
torted cells, and (d) the final detection of all cells.
In
Figure 8(a)
,
a colored, segmented image shows all unknown distorted shapes with a noise
similar to that produced by platelets, and so on. The current and potential sickle cells are de-
tected without any noise in
Figure 8(b)
. As a result, the deformed cells (current or potential
sickle) appear to number 57 out of 71. The final detection of distorted cells is contoured by
blue lines, as shown in
Figure 8(c)
.
In
Figure 8(d)
,
the final detection and tracking of all cells
(benign by gray color and distorted with dark gray color) has been completed.
In this experiment, the NN consists of 4 input variables, 10 neurons in one hidden layer, and
1 output layer. The network succeeds after 65 of 1000 maximum iterations of the epoch, with a
performance value of 0.0189, a gradient of 0.0165, and six validation checks, as shown in
Fig-
ure 9(a)
.
In
Figure 9(b)
, the best validation performance is shown as 0.00010338 at epoch 59,
with the training in a dark gray line, validation in a gray line, and the test in a red line. In the
same context, the MSE of training, validation, and testing processes are 2.059e−2, 1.03383e−2,
and 1.17910e−2, respectively.
FIGURE 9
(a) The back-propagation NN, and (b) the best validation performance.
Figure 10
shows the confusion matrices for training, validation, and testing processes. In
this figure, the predictions of the NN model are compared with the original classes of the tar-
get
T
c
to identify the values of TPs, TNs, FPs, and FNs. These values are computed to construct
the confusion matrix, in which each cell contains the number of cases classified for the corres-
ponding combination of desired and actual classifier outputs; it achieved 96.9%. Accordingly,
accuracy, sensitivity, and specificity approximate the probability of the positive and negative
labels being true and assess the usefulness the algorithm on an NN model. The accuracy, sens-
itivity, and specificity classifications of NN have achieved 98.4, 100, and 93.3% success with
training samples, respectively.
Search WWH ::

Custom Search