Image Processing Reference
In-Depth Information
objects in an image. This software also provides fine level adjustments on the object areas. Fin-
ally, all reference images were checked by the domain experts to minimize the human error.
The success of a binarization method can be measured in terms of the “similarity” of its out-
put binary image to the corresponding reference binary image. If the similarity is high then it
can be considered as a successful method. In order to measure similarity between two binary
images, in this study, we used a simple technique called “weighted sum.” In this technique we
basically sum (overlap) two binary images, after we multiply the reference image by 2,
(2)
where
I
S
,
I
R
, and
I
O
are the sum image, reference binary image, and the output binary image,
respectively. Suppose that the values of the pixels of protein instances are represented by “1”
and the background area is represented by “0” in the images. After the “weighted sum” oper-
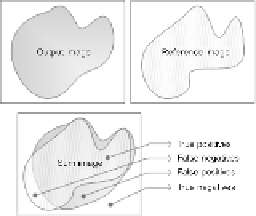
ation, the sum image will include “0s,” “1s,” “2s,” and “3s.” Every number has a special mean-
ing to measure the similarity. If the pixel value
p
ij
of the sum image is “3,” it is a
hit
, which
is also called as a True Positive (TP). If the pixel value is “2,” it is a
miss
, which is called as a
False Negative (FN). Similarly, if the pixel value is “1,” it is a
false alarm
, which is called as a
False Positive (FP). Finally if the pixel value is “0,” it is a
correct reject
, which is called as a True
Negative (TN). We can use these 4 values (TP, TN, FN, and TN) to measure the correctness of
the output binary image.
Figure 6
shows an example sum image that includes four regions.
FIGURE 6
Example sum image.
In the literature there are several measures that may provide correctness information from
diferent perspectives. It is important to use a proper accuracy measure that is more relevant
to the characteristics of our study. For example, the classical accuracy measure may not be a
proper technique for our study. Because in a typical protein binary image, there are usually
few number of foreground pixels compared to the background pixels. This means that the
TN pixels can easily suppress the accuracy even if there are no TP pixels. To avoid bias to-
wards a specific measurement method, we use and compare 4 well-known measures: Accur-
acy, F-Score (F-measure), Mathews correlation coeicient (MCC), and Jaccard (Jacc) similar-
ing equations show the formula of each measurement:

Search WWH ::

Custom Search