Environmental Engineering Reference
In-Depth Information
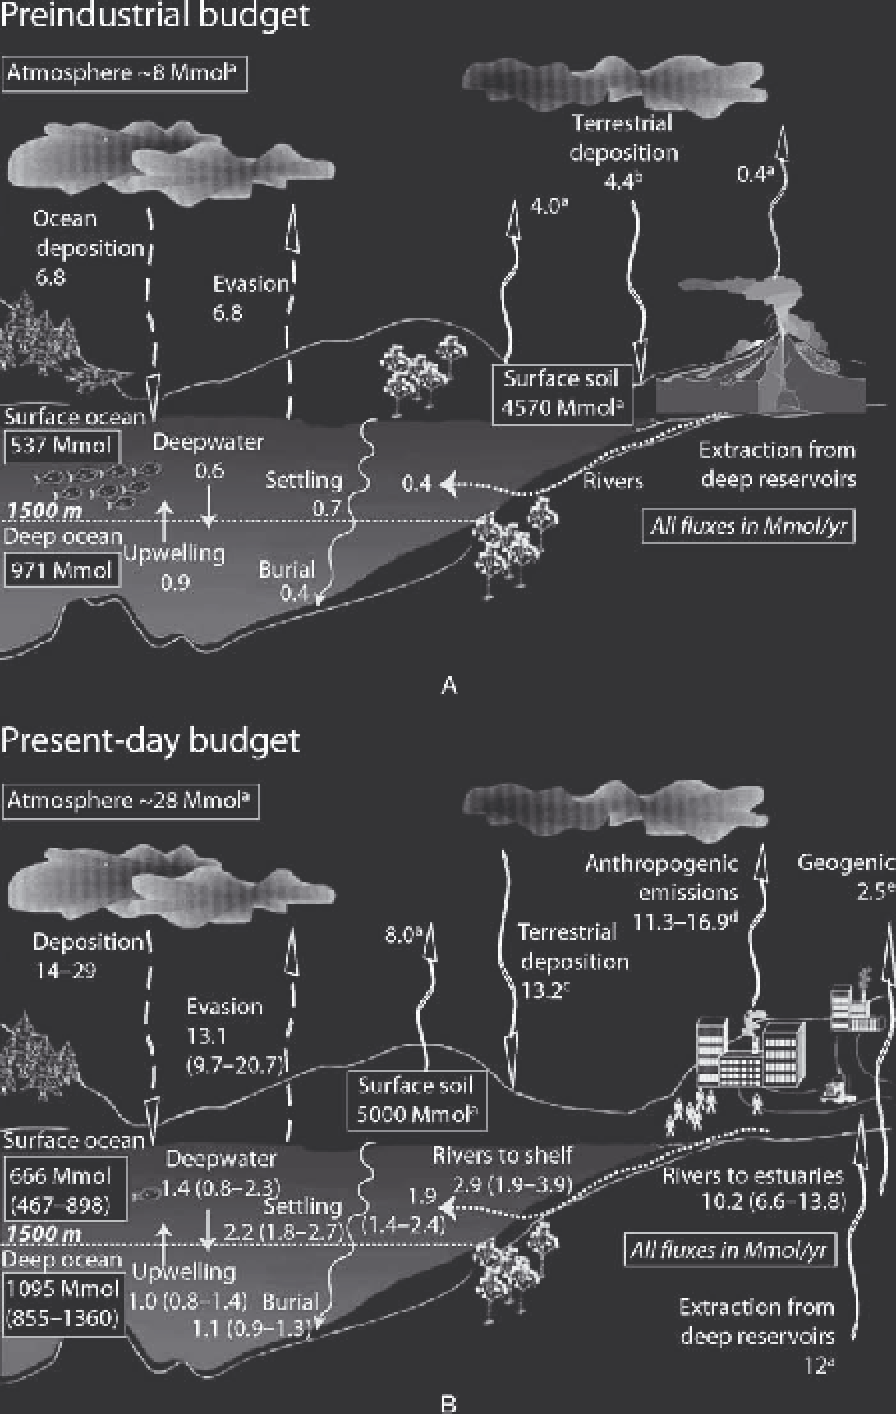
FIGURE 10.4
Global total mercury budget estimated under preindustrial and current conditions. In the
present-day budget, river fl uxes shown refer to the amounts of mercury deposited in each region (estu-
aries, shelf, open ocean), not the total fl ux (sum >14 Mmol).
a
From Mason and Sheu (2002).
b
Calculated
by assuming the preindustrial atmosphere is at steady state.
c
Estimated from sediment core data show-
ing that contemporary atmospheric deposition to terrestrial systems is approximately 3 times greater
than preindustrial deposition (Fitzgerald et al., 1998).
d
Lower end of range is year 2000 global anthro-
pogenic emissions from Pacyna et al. (2006). Upper limit of anthropogenic emissions were used in
GEOS-Chem simulations and include additional sources described by Selin et al. (2007).
e
Estimate
derived by Selin et al. (2007). 90% confi dence intervals are given in parentheses. (
Source:
Reprinted from
Sunderland and Mason, 2007, with permission from the American Geophysical Union.)