Information Technology Reference
In-Depth Information
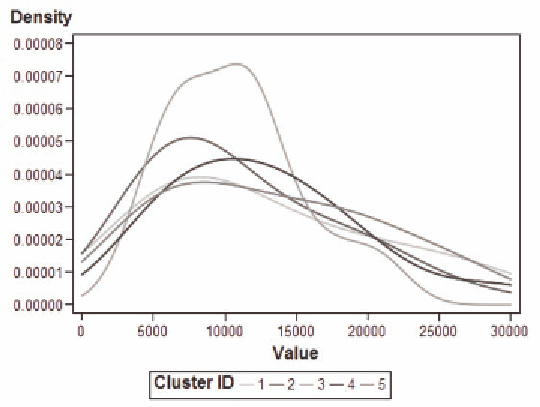
Figure 22. Kernel density of total charges by cluster
Table 14. Text cluster by hospital
Table of Hospital by Cluster
Hospital
Cluster
Total
Frequency
Row Pct
Col Pct
1
2
3
4
5
1
1
3.57
1.64
9
32.14
12.68
0
0.00
0.00
5
17.86
29.41
13
46.43
10.40
28
2
5
33.33
8.20
2
13.33
2.82
0
0.00
0.00
0
0.00
0.00
8
53.33
6.40
15
3
2
25.00
3.28
4
50.00
5.63
0
0.00
0.00
0
0.00
0.00
2
25.00
1.60
8
4
15
23.44
24.59
16
25.00
22.54
2
3.13
15.38
5
7.81
29.41
26
40.63
20.80
64
5
6
25.00
9.84
14
58.33
19.72
1
4.17
7.69
0
0.00
0.00
3
12.50
2.40
24
6
6
11.32
9.84
13
24.53
18.31
0
0.00
0.00
0
0.00
0.00
34
64.15
27.20
53
7
0
0.00
0.00
4
33.33
5.63
0
0.00
0.00
1
8.33
5.88
7
58.33
5.60
12
9
14
25.45
22.95
4
7.27
5.63
1
1.82
7.69
6
10.91
35.29
30
54.55
24.00
55
10
12
42.86
19.67
5
17.86
7.04
9
32.14
69.23
0
0.00
0.00
2
7.14
1.60
28
Total
61
71
13
17
125
287


Search WWH ::

Custom Search