Information Technology Reference
In-Depth Information
Table 12. Actual versus predicted mortality values by hospital
Hospital
Actual Mortality
Predicted Mortality
Difference
1
2.88
30.06
27.18
2
3.05
29.68
26.63
3
2.54
35.06
32.52
4
2.24
23.89
21.65
5
2.11
25.95
23.84
6
3.16
39.87
36.71
7
1.93
14.49
12.56
8
0
0
0
9
1.38
15.76
14.38
10
0.37
0.23
-0.14
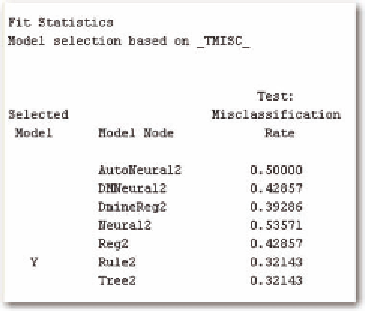
Figure 35. Mortality prediction for patients with COPD
The lift function indicates that the top half of the data can be predicted easily (Figure 38). However,
the test data are much less predictable compared to the training set.
The decision tree indicates that prediction is based largely upon the occurrence of congestive heart
failure in the model (Figure 39). For this reason, a provider that can increase the proportion of patients
identified as having congestive heart failure will rank higher compared to those who do not inflate the
proportion. This condition is loosely defined as a disease that weakens the heart muscle, or weakens
the ability of the heart to pump. The definition tends to be vague, and the condition can be assigned
differently by different providers.
We translate procedures in Table 14; Table 15 gives the number of procedures by hospital. In both
cases, the total sample size is restricted to the ten hospitals with the given procedures.
We compare the difference between the actual and predicted mortality by hospital (Table 16). Table
17 gives the actual and predicted values by procedure.
Table 15 shows the relationship of hospital to procedure. It shows that there is a considerable differ-
ence in the procedures performed across the hospitals. For example, #1 has over 50% in 3615, Single
internal mammary-coronary artery bypass. The remaining hospitals are more divided in their procedures.


Search WWH ::

Custom Search