Information Technology Reference
In-Depth Information
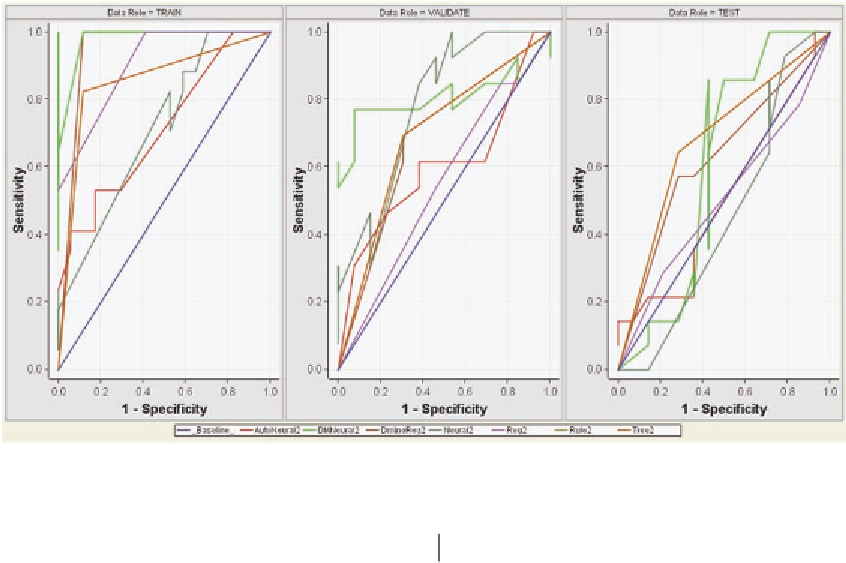
Figure 36. ROC curves for predicted results
Table 13. Actual versus predicted mortality values by hospital for patients with COPD
Hospital
Actual Mortality
Predicted Mortality
Difference
1
3.94
23.62
19.68
2
7.94
33.33
25.39
3
2.13
44.68
42.55
4
4.78
29.57
24.79
5
4.65
29.07
24.42
6
3.21
27.98
24.77
7
3.85
50.00
46.15
8
No COPD Patients
9
4.11
43.84
39.73
10
0
0
0
Hospital #4 has almost 30% in 3614, (Aorto)coronary bypass of four or more coronary arteries, sug-
gesting that it treats patients with very severe blockage in the coronary vessels. The same hospital has
approximately 20% of its procedures in 3611, 3612, and 3613.
Table 15 shows that there is considerable difference in the procedures performed across the hospitals.
For example, #1 has over 50% in 3615, Single internal mammary-coronary artery bypass. The remaining
hospitals are more divided in their procedures. Hospital #4 has almost 30% in 3614, (Aorto)coronary
bypass of four or more coronary arteries, suggesting that it treats patients with very severe blockage in
the coronary vessels. The same hospital has approximately 20% of the procedures in 3611, 3612, and
3613.


Search WWH ::

Custom Search