Environmental Engineering Reference
In-Depth Information
W
calcite, init
= 2.5
W
calcite, init
= 5
W
calcite, init
= 10
(a)
(b)
(c)
30º
0º
-30º
(d)
(e)
(f)
30º
0º
-30º
(g)
(h)
(i)
30º
0º
-30º
(j)
(k)
(l)
30º
0º
-30º
(m)
(n)
(o)
30º
0º
-30º
0
1
2
3
4
5
6
0
1
2
3
4
5
6
0
1
2
3
4
5
6
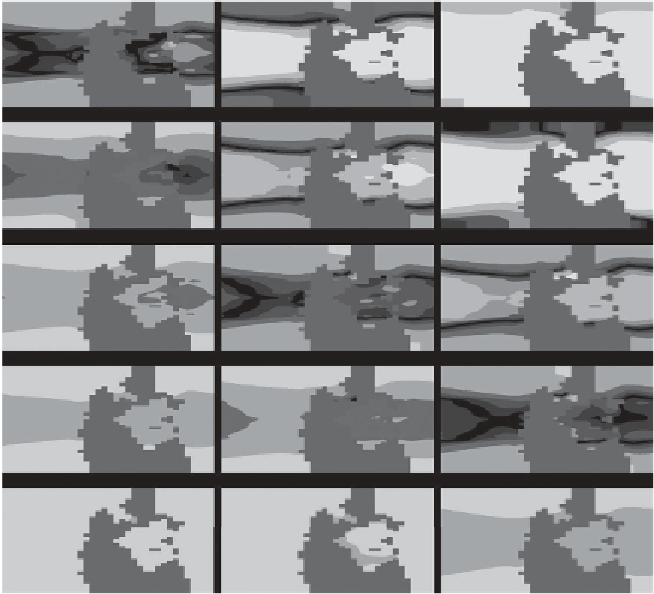
Figure 19.5 Map view of the initial ocean-surface saturation state of calcite
(a,
10) and map view of the
ocean-surface saturation state for the twelve selected scenarios (d
Ω
calcite,init
¼
2.5; b,
Ω
calcite,init
¼
5; c,
Ω
calcite,init
¼
o) when min-
imum ocean saturation is achieved. A black and white version of this
-
figure will
appear in some formats.
For the colour version, please refer to the plate section
.
13
C-depleted sources with initial
undersaturation is also observed for the more
13
Ω
¼
2.5, and the case where
δ
C
source
¼ -
15
‰
and initial
Ω
¼
5. No
calcite
calcite
large regions of undersaturation are observed for the rest of the scenarios.
The depth of the saturation horizon before and during the perturbation for the
selected 12 scenarios is shown in
Figures 19.6a
-
o
. The depth of the saturation
horizon is shallower than 1000 m for an initial
Ω
calcite
of 2.5 and deeper than
4000 m for an initial
calcite
of 10. The depth of the saturation horizon during peak
C addition is dependent upon the initial
Ω
13
Ω
C
source
. In the most
severe C addition case (scenario 1), the depth of the saturation horizon rises up
from a fully saturated ocean (
Figure 19.6c
)to
<
500 m in mid- to low-latitude
regions during peak C addition (
Figure 19.6o
).
calcite
and the
δ


