Environmental Engineering Reference
In-Depth Information
(a)
(b)
(c)
W
calcite, init
= 2.5
W
calcite, init
= 5
W
calcite, init
= 10
0
1000
2000
3000
4000
0
1000
2000
3000
4000
0
1000
2000
3000
4000
-90
-60
-30
0
30
60
90
-90
-60
-30
0
30
60
90
-90
-60
-30
0
30
60
90
Latitude (
o
N)
Latitude (
o
N)
Latitude (
o
N)
(d)
(e)
(f)
0
1000
2000
3000
4000
0
1000
2000
3000
4000
0
1000
2000
3000
4000
-90
-60
-30
0
30
60
90
-90
-60
-30
0
30
60
90
-90
-60
-30
0
30
60
90
Latitude (
o
N)
Latitude (
o
N)
Latitude (
o
N)
(g)
(h)
(i)
0
1000
2000
3000
4000
0
1000
2000
3000
4000
0
1000
2000
3000
4000
-90
-60
-30
0
30
60
90
-90
-60
-30
0
30
60
90
-90
-60
-30
0
30
60
90
Latitude (
o
N)
Latitude (
o
N)
Latitude (
o
N)
(j)
(k)
(l)
0
1000
2000
3000
4000
0
1000
2000
3000
4000
0
1000
2000
3000
4000
-90
-60
-30
0
30
60
90
-90
-60
-30
0
30
60
90
-90
-60
-30
0
30
60
90
Latitude (
o
N)
Latitude (
o
N)
Latitude (
o
N)
(m)
(n)
0
1000
2000
3000
4000
0
1000
2000
3000
4000
0
1000
2000
3000
4000
-90
-60
-30
0
30
60
90
-90
-60
-30
0
30
60
90
-90
-60
-30
0
30
60
90
Latitude (
o
N)
Latitude (
o
N)
Latitude (
o
N)
0
1
2
0
1
2
0
1
2
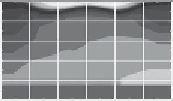
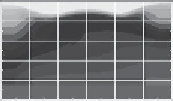
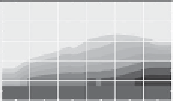
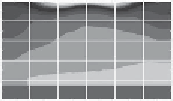
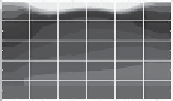
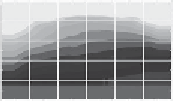
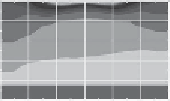
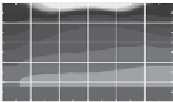
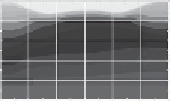
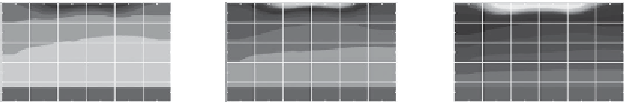
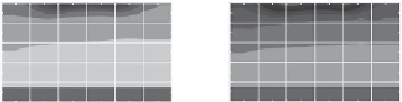
Figure 19.6 Depth pro
les of the initial ocean saturation state of calcite (a,
Ω
calcite,init
¼
10) and the selected four
scenarios as in
Figure 19.5
, when minimum ocean saturation is acheived. A black
and white version of this
2.5; b,
Ω
calcite,init
¼
5; c,
Ω
calcite,init
¼
figure will appear in some formats.
For the colour
version, please refer to the plate section
.
The red coloration indicates supersatur-
ation, and the blue, undersaturation.
To put the spatial pattern of ocean acidi
cation in context, we compare our
Ω
calcite
results to an ocean-only simulation that spans preindustrial time to the
future. Using a version of GENIE described in Cao
et al
.(
2009
), following the
IPCC (2007) RCP8.5 trajectories for atmospheric CO
2
, this simulation yields
the following responses (
Figure 19.7
). We see a clear top-down acidi
cation from
preindustrial to modern time, and further deterioration in supersaturation to 2100,
as atmospheric
p
CO
2
approaches
~
-
900 ppm (
Figures 19.7a