Biology Reference
In-Depth Information
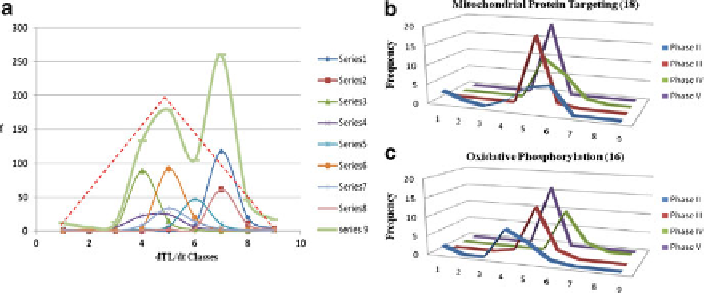
Fig. 12.29 The distributions of the slopes (i.e., dTL/dt) of RNA trajectories of budding yeast
undergoing glucose-galactose shift. The
y
-axis represents the frequency (f) and the
x
-axis the rate
(or slope) classes divided into nine based on Table
12.12
.(a) Series 1
¼
chromatin structure (38
RNAs); Series 2
¼
DNA repair (21); Series 3
¼
glycolysis (30); Series 4
¼
meiosis (17); Series
5
¼
mitochondrial protein targeting (19); Series 6
¼
nuclear protein targeting (32); Series 7
¼
oxidative phosphorylation (16); Series 8
¼
protein folding (28); Series 9
¼
sum of series (201
RNAs). The red dotted lines indicate the slope distribution predicted by in Table
12.12
.(b) The
phase-dependent slope distributions of the 18 RNA trajectories belonging to the mitochondrial
protein targeting metabolic pathway. In Phase II and IV, the fifth slope or rate class is dominant
with no contributions from the fourth and sixth slopes or rate classes. In contrast, the fourth and
sixth classes dominate during Phases III and V, respectively. (c) The phase-dependent slope
distributions of the 16 RNA trajectories belonging to the oxidative phosphorylation metabolic
pathway. Again, in Phase II and IV, the fifth slope or rate class is dominant with no or little
contributions from the fifth and sixth slopes or rate classes. In contrast, the sixth and fourth classes
dominate during Phases III and V, an opposite pattern to what was observed in (b). Phase I slopes
are not included because they are likely to contain large errors due to the short time of observation,
5 min. For the definition of the phases, see Fig.
12.30
behavior depicted as a red triangle. However, two interesting features emerge. (1)
Different metabolic pathways tend to show peak frequencies located at different
rate classes (see a in Fig.
12.29
), and (2) different phases within a given metabolic
pathway tend to show peak frequencies at different rate classes (see b and c in
Fig.
12.29
). Thus, the possibility suggests itself that two metabolic pathways that
overlap in a two-dimensional frequency-rate class (FR) plot such as Fig.
12.28a
may
be distinguishable in three-dimensional frequency-phase-rate class (FPR) plots such
as Fig.
12.29b
, c and this may make the FPR plots a sensitive tool for monitoring cell
As indicated above and according to Eq.
12.42
and Statement 12.43, the rate
constant of an enzyme or an enzyme complex is an exponential function of the
Gibbs free energy level of the enzyme. Hence it should be possible to infer the changes
in the Gibbs free energy levels of transcriptosomes (T) and degradosome (D) from the
kinetic patterns of TL or the RNA trajectories which reflect the enzymic activities of
T and D (see Steps 1 and 2, and 4 and 5 in Fig.
12.27
). A prototypical RNA trajectory
of budding yeast undergoing glucose-galactose shift is schematically depicted in
Panel a in Fig.
12.30
. During each of the five phases, TL exhibits one of the nine