Biology Reference
In-Depth Information
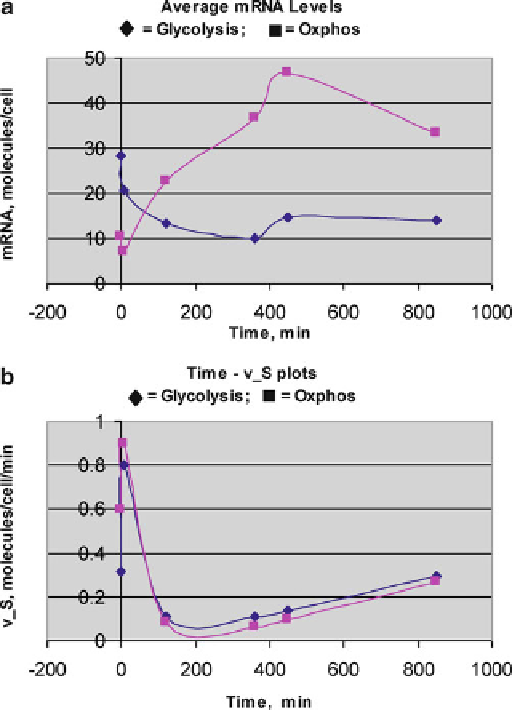
Fig. 12.2 The average time courses of the transcript levels (TL) and transcription rates (TR) of 14
each of the glycolytic and respiratory (also called oxidative phosphorylation, or ox phos) genes
(Garcia-Martinez et al. 2004; Ji et al. 2009a)
6 time points: 0, 5, 120, 360, 450, and 850 min after the nutritional shift. Except
two trajectories in Fig.
12.1b
(brown and yellow trajectories) and one in Fig.
12.1c
(yellow), most of the 15 transcripts show kinetic behaviors that are similar to the
genome-wide average kinetic behavior shown in Panel in Fig.
12.1d
, despite the fact
that the scale of the y coordinates varies over two orders of magnitude. The overall
quality of the kinetic data, as evident in the smooth and coherent trajectory exhibited
by each gene, increases our confidence in the microarray experimental method.
The three unusual trajectories seen in Figs.
12.1b
, c are most likely not artifacts of
measurement but most likely reflect genuine biological responses of the associated
genes to the nutritional stress.