Database Reference
In-Depth Information
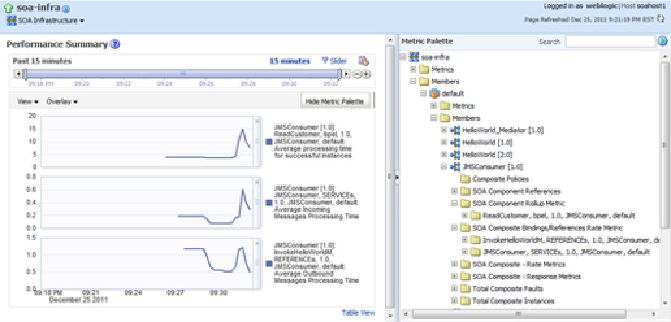
tion. From these metrics, we can determine that during the peak time, the con-
sumption of the message (peak
0.6
seconds) and the invocation of the target
mediator service (peak
1.0
seconds) were probably not the cause of the spike of
15
seconds total end-to-end processing time of the composite.
So, there must have been something else within the composite that resulted in
the poor performance under load.
Viewing request processing metrics
To view request processing metrics:
1.
On the navigator, expand
SOA
, right-click on
soa-infra
, and navigate to
Monitoring
|
Request Processing
.
2.
The
Request Processing
page is displayed, revealing
Service Engines,
Service Infrastructure
, and
Binding Component
metrics.
3.
The following screenshot shows the
Service Engines
metrics on this page.
These are high level metrics at the
Service Engine
level: