Environmental Engineering Reference
In-Depth Information
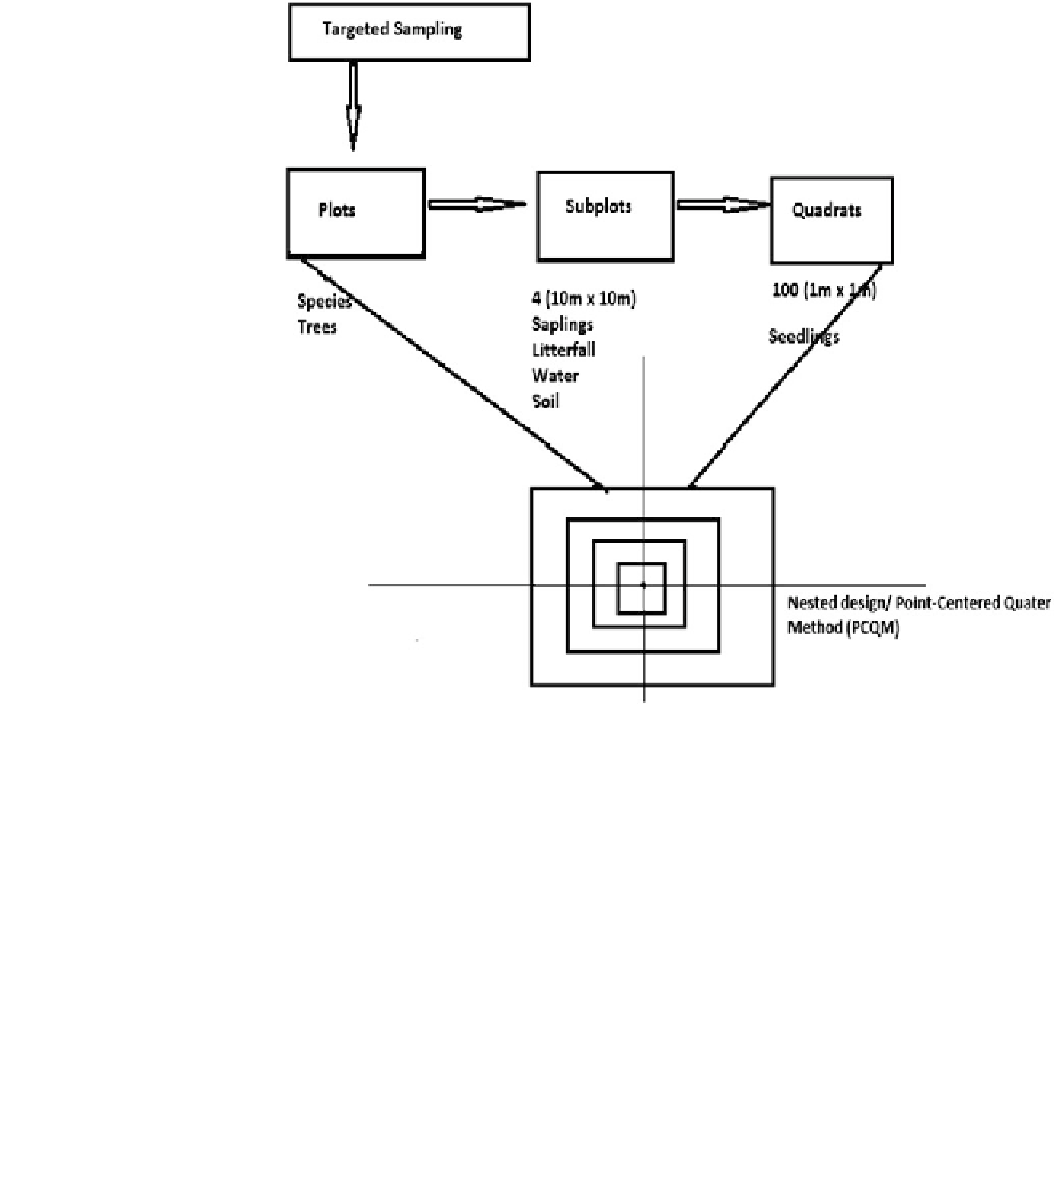
Fig. 3
Schematic sampling
design showing the methodology
used for the study (Target
sampling followed by a point-
centered quarter method one plot
(20 9 20 m) subdivided in four
subplots 4 (10 9 10 m) and each
subplot in hundred quadrats 100
(1 9 1 m); inventory of
seedlings in 100 (1 9 1m)
quadrats and saplings and trees in
4 subplots (10 9 10 m) in each
mangrove stand (Rhizophora,
Avicennia, mixed). After
inventory, collection of litterfall
has been made once a month in
the morning in 4 subplots
(10 9 10 m) in each mangrove
stand, from November 2008 to
November 2010 in both
countries)
into a desired measurement level corresponding to the point-
centred quarter method (PCQM) revised and described by
Dahdouh-Guebas and Koedam (
2006
). At each site, each of
the plots (20 9 20 m = 400 m
2
) corresponding to one
species or mixed was marked out. Each plot was further
divided into four 10 9 10 m (100 m
2
) subplots and each
subplot into a hundred 1 9 1 m sampling quadrants, and
forty of them were randomly selected for some measure-
ments (Fig.
4
). Therefore, for this research in each country, a
total of 3 plots and 12 subplots covering an area of 0.24 ha
were established. Plots and subplots were then used for some
of the parameters as tree inventory, litterfall production and
water and soil measurements (Dahdouh-Guebas and Koe-
dam
2006
; Armah et al.
2009
; Spalding et al.
2010
). After
selecting and laying out the plots, they were monitored for
26 months, selecting ecological processes from November
2008 to November 2010 (Ghana and Cameroon).
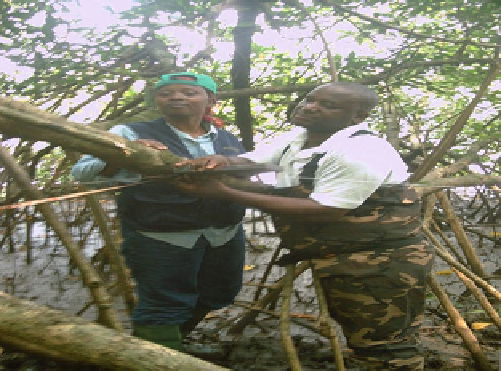
Fig. 4
Materialization of the sampling design in the field at Douala-
Edea reserve, Cameroon (photo Carole Ntyam 2010)
identified, counted and measured for diameter at breast
height (DBH) and height. In the subplots, all saplings with
height between 1 and 4 m and seedlings below 1 m were
counted and measured for DBH and height (English et al.
1997
; Dahdouh-Guebas
2011
). During the inventory, red
mangrove, the most abundant species, with prop-roots and
multiple stems, had their DBH measured above the highest
Measurement of Tree and Stand Parameters
for Forest Structure
Plots were designed to inventory trees, and subplots were
used to inventory saplings and seedlings (Fig.
5
). In each
plot, all individual trees with height greater than 4 m were
Search WWH ::

Custom Search