Biomedical Engineering Reference
In-Depth Information
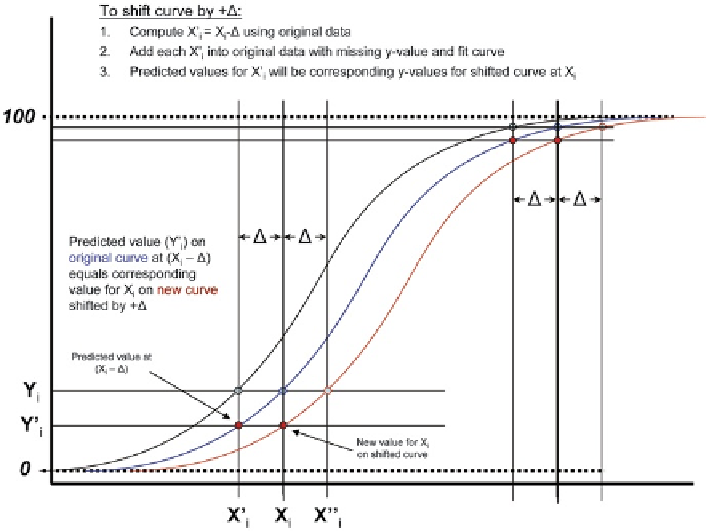
Fig. 8.45
“Christopher-Dey” expansion of the range of OIP CI-determined APSD data using
simulation techniques that maintained the characteristics of the original CI data; the process
involved shifting the cumulative APSD by a size amount “±Δ”
An example of this approach applied to a set of CI data is shown in Figs.
8.46
and
8.47
.
Using the original data and the approach described in Tougas et al. [
3
], the
LPM
/
SPM
ratios were calculated using a boundary near the average
MMAD
to sepa-
rate the
ISM
into its component parts,
LPM
and
SPM
. As with the grouped-stage
data, a suitable regression model was used to determine the relationship between the
LPM
/
SPM
ratio and
MMAD
, with a prediction interval, representing some level of
uncertainty, around the regression line. The intersection of the prediction limits with
the acceptable
MMAD
range was used to determine the acceptance limits for the
LPM
/
SPM
ratio that corresponded to grouped-stage acceptance limits for the estab-
lished range of acceptable
MMAD
values (see Fig.
8.48
).
Simulated cascade impactor-generated data was generated (SAS version 9.1,
SAS Institute, Cary, NC, USA) using the expanded data set to model the original CI
data, incorporating not only the mean and variability of the deposited mass on each
impactor stage but also the interrelationships among the stages [
17
,
18
].
For example, the simulated data reflected the same pattern as the observed data
such that in a given CI run, a higher mass deposited on one stage generally results
in a lower amount on another stage, and vice versa.
Another important aspect of the simulation is that the modeling does not require
that mass deposition on each stage follow a normal distribution. For each of the sets
Search WWH ::

Custom Search