Biomedical Engineering Reference
In-Depth Information
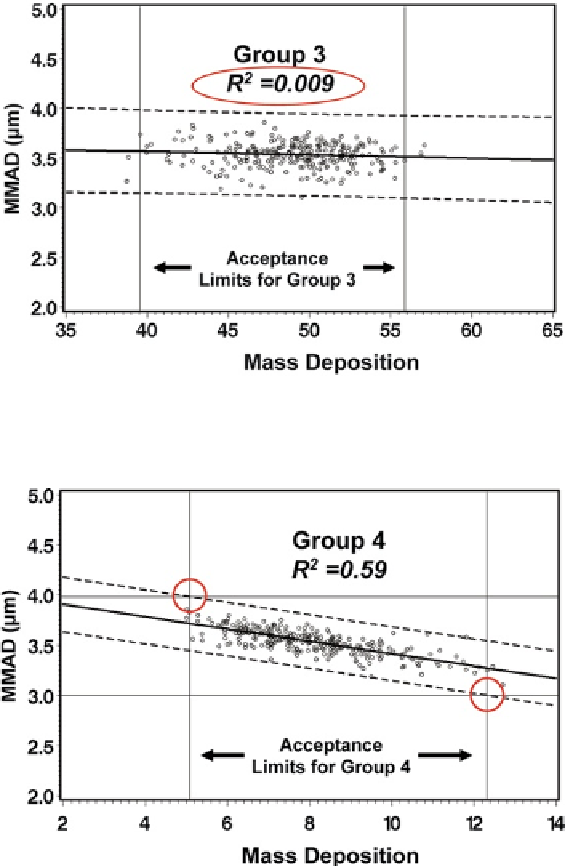
Fig. 8.43
Stage group 3 mass deposition data as a function of
MMAD
; the
dashed lines
represent
the prediction interval limits, and the extremely small value of
R
2
is highlighted, demonstrating the
lack of a correlation
Fig. 8.44
Stage group 4 mass deposition data as a function of
MMAD
; the
dashed lines
represent
the prediction interval limits with the circles defining the upper and. lower limits for
MMAD
, each
defined by the intersection between the appropriate prediction interval limit and the corresponding
acceptance limit for group 4
A new set of shifted data was created by matching these predicted values to the
original
d
50
sizes, and by scaling the deviation from the original predicted value,
assuming constant coefficient of variation (CV), to maintain variability characteristics
consistent with the original data and with principles governing particle size shifts in
OIPs. Shifted sets of data were generated at the appropriate deltas to provide sufficient
coverage at and slightly beyond the extremes of the
MMAD
range to provide a suit-
ably expanded data set for assessment. The process used is illustrated in Fig.
8.45
.
Search WWH ::

Custom Search