Biomedical Engineering Reference
In-Depth Information
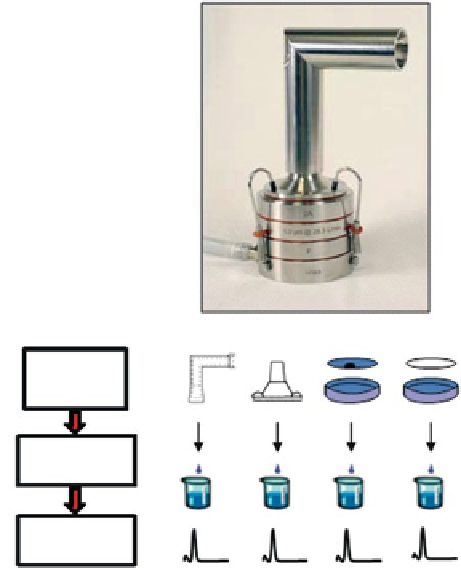
Fig. 4.6
Potential steps
involved in API recovery and
assay with abbreviated CI
based on ACI design
Abbreviated
CI
Sample
Collection
Sample
Preparation
API Assay
impaction procedure. These data may be handled in several different ways in order
to arrive at meaningful measures of OIP aerosol performance. There are at least
three distinctly different ways in which to represent the raw data (Table
4.3
).
Mitchell and Dunbar noted that the simplest approach is to treat the API mass
distribution as a nominal function of CI stages and the non-sizing auxiliary compo-
nents, such as the induction port and pre-separator (if used) [
78
]. These values are
related to the locations of the discrete stages and auxiliary components in the entire
CI system by name only and without order (left-hand illustration in Fig.
4.7
).
There is no size scaling whichever representation method is chosen, and it is not
possible to compare findings from different CI systems meaningfully in this way.
The data are commonly rank-ordered (right-hand illustration in Fig.
4.7
), for
comparison with equivalent results obtained by the same system.
It therefore becomes necessary to explore other perhaps more informative ways
of looking at the descriptive statistics that are available from the raw data provided
by CI measurements and derive inferential statistical relationships from metrics
such as SPM, LPM, EPM, FPM, CPM, and their related mass fractions, as well as
ISM and the total mass entering the system, including the non-sizing components.
As the first step in this process, the mass of API can be presented as an ordinal
function of CI size-separation stage range (Fig.
4.8
), the mass of API collected from
a particular stage,
i
, is linked to the
d
50
value of the preceding stage (
i
− 1).
Search WWH ::

Custom Search