Agriculture Reference
In-Depth Information
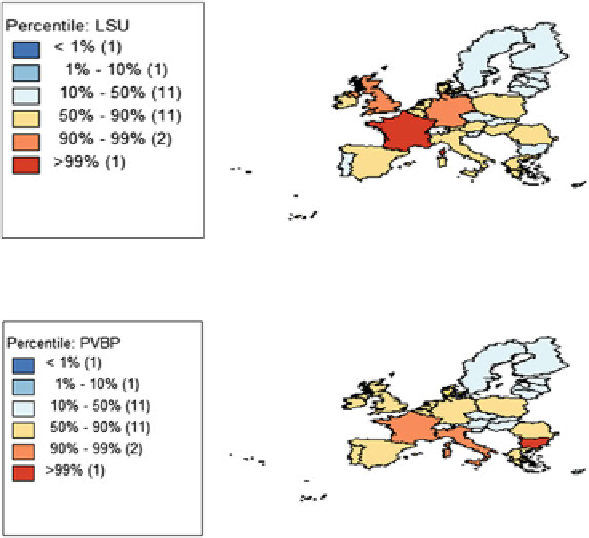
Fig. 3.10 Logarithm of the average LSU livestock among European Union countries
Fig. 3.11 Logarithm of the average production value at basic price (base year: 2005
100)
¼
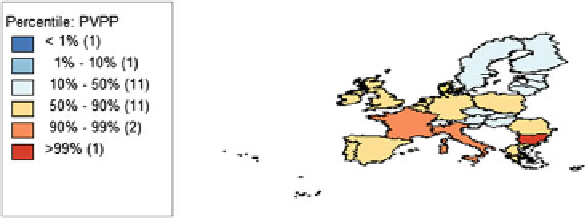
Fig. 3.12 Logarithm of the average production value at producer price (base year: 2005
¼
100)
The following six figures (Figs.
3.13
,
3.14
,
3.15
,
3.16
,
3.17
, and
3.18
) present the
values of Moran's I statistics for the global spatial autocorrelation (for the 27 coun-
tries considered). When the value of the Moran's I is positive/negative, this signifies
that the values of the variable considered in a determined location (in this case
country) are positively/negatively correlated with the values of the same variable
for neighboring locations (countries). If, the Moran's I statistics are zero, there isn't
spatial autocorrelation for the variable among the neighbors' locations. To measure
the proximity between neighboring countries, in this study we considered a matrix
of queen contiguity, considering only one neighbor country in all directions
Search WWH ::

Custom Search