Agriculture Reference
In-Depth Information
Fig. 3.7 Logarithm of the average utilized agricultural area (ha) among European Union countries
Fig. 3.8 Logarithm of the average AWU Labour force—directly employed by the holding among
European Union countries
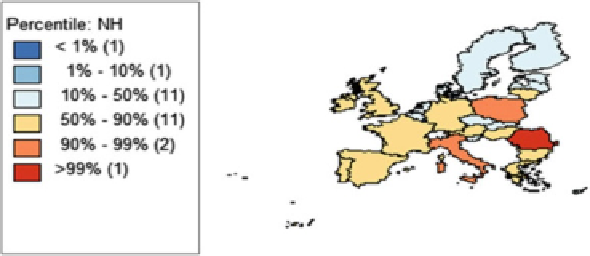
Fig. 3.9 Logarithm of the average number of holdings among European Union countries
the Common Agricultural Policy. The values for Bulgaria seem strange and need
more careful analysis in future research.
Figures
3.7
,
3.8
,
3.9
,
3.10
,
3.11
, and
3.12
present the same data shown in the
previous six figures, but now in average and in the logarithm for the period 1990-
2007 (the coincident period for all the variables). These figures confirm the afore-
mentioned for each single variable analyzed.

Search WWH ::

Custom Search