Environmental Engineering Reference
In-Depth Information
79 23' 05”
79 38' 20”
N
13
13
38
'
38'
Calcium
29”
29”
Location
< 509
509 - 623
623 - 737
737 - 851
13
13
36
'
36
'
> 851
23”
23”
375 750
1,500
2,250
3,000
Meters
0
79
23' 05”
79
38' 20”
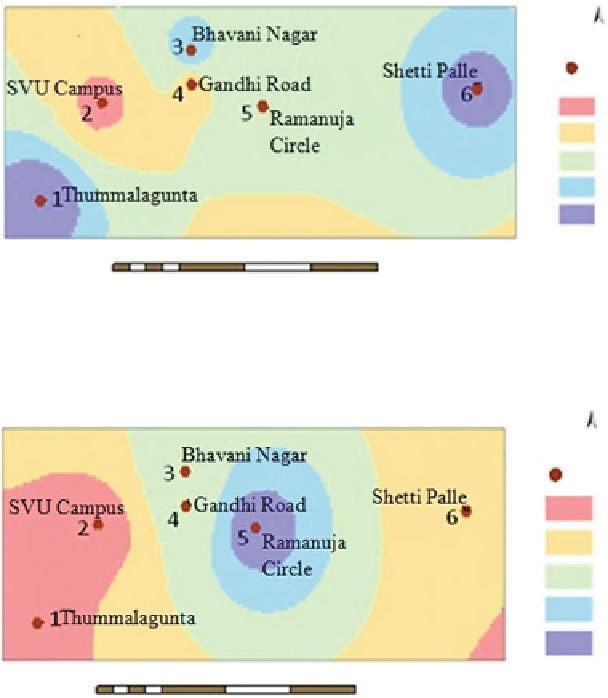
Fig. 7
Spatial distribution of calcium
N
79
23' 05”
79
38' 20”
13
13
Magnesium
38
'
38'
29”
Location
< 77
29”
77 - 96
96 - 115
115 - 134
13
13
36
'
36
'
> 134
23”
23”
79
23' 05”
0
375 750
1,500
2,250
3,000
Meters
79
38' 20”
Fig. 8
Spatial distribution of magnesium
to Na and Cl may be attributed to terrestrial sources. Ca and Mg are considered to
be crustal elements, and main sources are soil dust and windblown rock-derived
minerals. Spatial distribution of Ca in the study area is shown in Fig.
7
and found to
be distributed over the west to the east region. Some higher concentration pockets
are seen at eastern region area, SP and southwest corner area, TG. This is attributed
to the soil dust which was due to cultivated land present near these areas. Figure
8
shows the spatial distribution of Mg and is found to be lowest in the southwest
region (TG and SVUC). Higher concentration pockets are seen in the centre of the
map (RC). Higher concentrations are attributed to traffi c dust, because these regions
are located at high traffi c centre. Soil dust may be considered to be main source for
both Mg and Ca in the study area. Figure
9
shows the spatial variation of K in the
study area. As seen from Fig.
9
, the low concentrations are seen in the southwest
corner (TG) and eastern region (SP), whereas higher concentrations are seen in the
Search WWH ::

Custom Search