Environmental Engineering Reference
In-Depth Information
79 23' 05”
79 38' 20”
N
13
13
38
'
38'
Potassium
29”
29”
Location
< 216
216 - 276
276 - 336
336 - 396
13
13
36
'
36
'
23”
23”
> 396
79
23' 05”
0
375 750
1,500
2,250
3,00
Meters
79
38' 20”
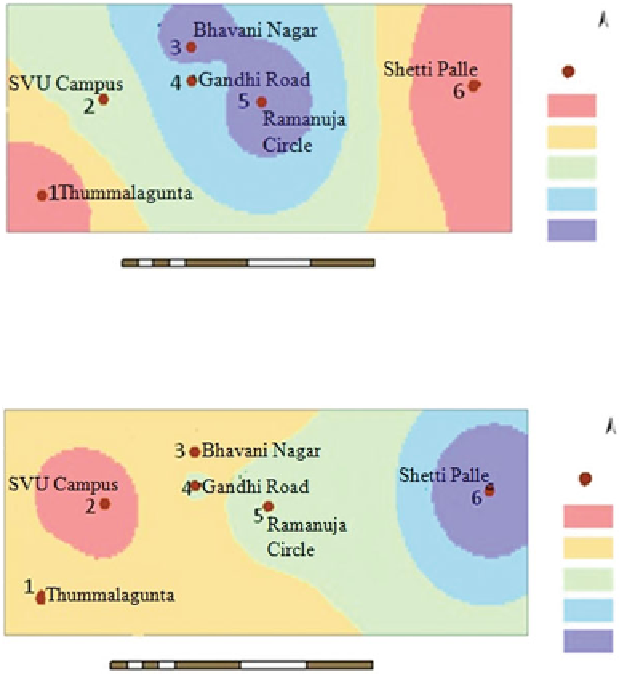
Fig. 9
Spatial distribution of potassium
79
23' 05”
79
38' 20”
N
13
13
38
'
38'
29”
Fluoride
29”
Location
< 21
21 - 31
31 - 41
41 - 51
13
13
36
'
36
'
23”
23”
> 51
79 23' 05”
0
375 750
1,500
2,250
3,00
Meters
79
38' 20”
Fig. 10
Spatial distribution of fl uoride
centre of the map. Higher concentrations may be attributed to traffi c dust and com-
bustion process. Figure
10
shows spatial distribution of F in the study area and
found to be distributed over the west to the eastern region. Higher concentrations
may be due to the presence of small scale industries in the eastern region. Fluoride
may be contributed by emission from industrial activities like brick kilns and lime
pulverization units situated in and around the study area.
Air Quality Assessment
Only TSP has been taken for further classifi cation, because, there are no standards
established for ionic composition studied by any agency. TSP was classifi ed into
four categories according to NAAQS i.e. excellent (0-100), good (100-200), moderate
(200-300) and poor (>300). The classifi ed map of TSP is shown in Fig.
11
. It can be seen
Search WWH ::

Custom Search