Information Technology Reference
In-Depth Information
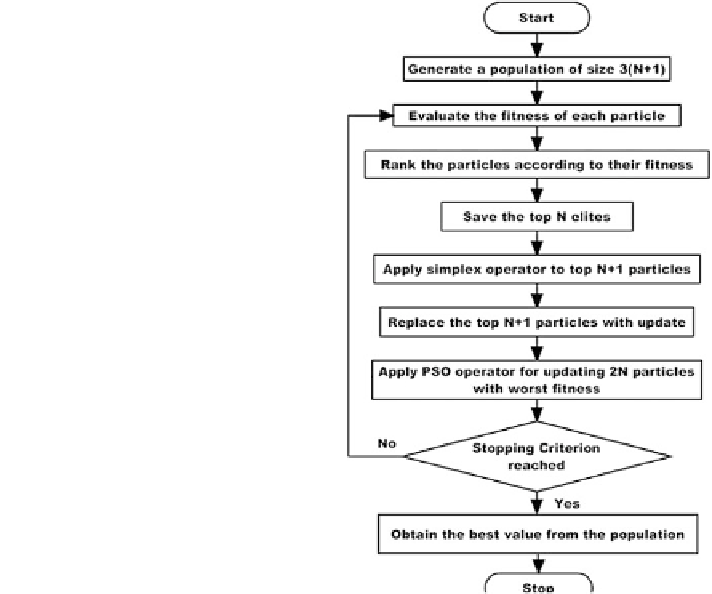
flowchart of the algorithm is given in Fig.
9
.
Initially, a population of size 3(N + 1) is generated and evaluated. Particles are
ranked based on their
For an N-dimensional problem, the
fl
fitness values. The top N elite values are saved and NM
method is applied to the top N + 1 particles. PSO operator is then applied to the
remaining 2 N particles with worst
fitness. Then, the stopping criterion is checked
for all the 3(N + 1). If the criterion is achieved, then the process stops and best
solution is achieved, otherwise,
the
fitness values are again repeated and the
complete process repeats.
5 Solution Methodology
Based on this load
flow and proposed objective function, the capacitors are placed
at respective buses using the algorithm presented in Fig.
10
. According to it, the
system parameters are entered in the program. Based on the system parameters and
sensitivity the candidate buses are selected. On the selected buses, the capacitors are
placed using the optimization algorithm and objective function evaluation. After the
capacitor placement, the constraints are checked.
fl
Fig. 10 Flowchart for
Nelder-Mead particle swarm
optimization (NM-PSO)
algorithm
Search WWH ::

Custom Search